Figures & data
Table 1. Baseline characteristics.
Table 2. Average symptom scores for endometriosis patients vs healthy controls, measured in real-time, several times a day.
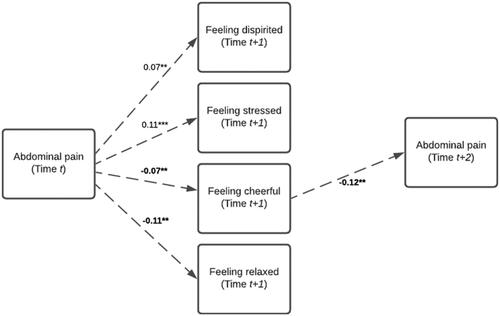
Table 3. Associations between abdominal pain and affect in endometriosis patients and healthy controls.
Figure 1. Longitudinal scores for abdominal pain and “feeling dispirited” for two individual patients. The x-axis represents the 70 consecutive assessments: each within a 90-minute timeframe between 7:30 AM and 10:30 PM for each day with a maximum of 10 assessments per day. The heterogeneity between subjects with endometriosis is shown by the different patterns of symptom scores; also indicated by the difference in corresponding regression coefficients for a. 0.12; b. 1.07.
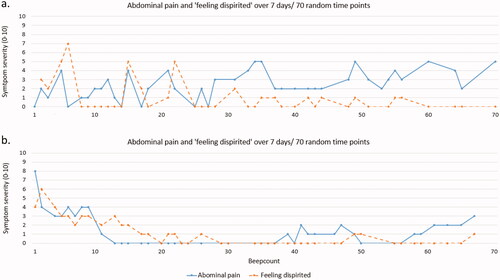
Figure 2. Temporal associations from abdominal pain at time t to the severity of positive and negative affective symptoms at t + 1, and vice versa. The numbers represent Beta coefficients, tested using multi-level linear regression modeling on ESM data. *P < 0.01; **P < 0.001. Bold numbers represent negative predictions. Only significant associations are shown, therefore all lines represent predictions for endometriosis patients. No significant temporal associations were found for healthy controls. Questionnaires are assessed within a 90-minute timeframe. However, as patients were not obligated to fill in every questionnaire during the day, the follow-up questionnaire could be assessed later on the same day.