
Figures & data
Figure 1. Preoperative gastric sonogram. The sonogram shows a sagittal scan of an empty gastric antrum. L: liver; A: gastric antrum; SMA: superior mesenteric artery; Ao: aorta.
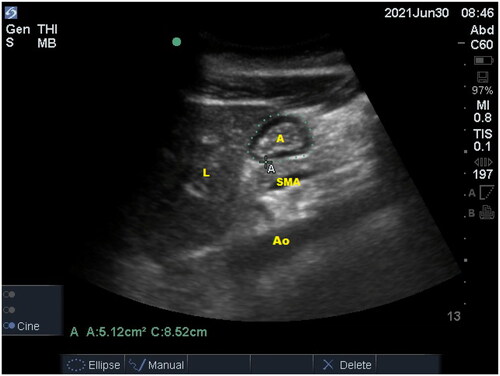
Figure 2. The enrollment flow diagram. GA: general anesthesia; LMA: laryngeal mask airway; US: ultrasound.
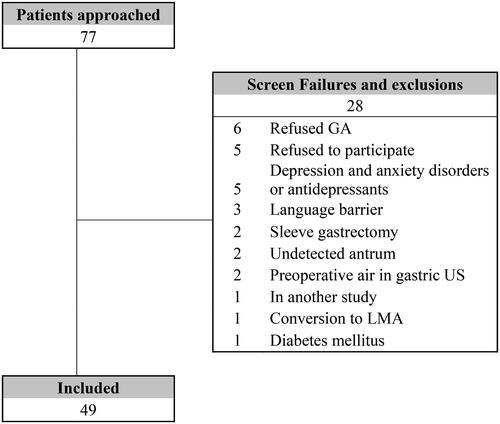
Table 1. Patient characteristics and perioperative data.
Table 2. Multivariable linear regression model including patient-related factors.
Table 3. IVF cycle data.