
Figures & data
Table 1. Descriptives and bivariate correlations of the study variables.
Table 2. Results of models regressing standardized period pain presenteeism on the standardized covariates and predictors.
Figure 1. Plot of the association between degree of disclosure to the supervisor and period pain presenteeism moderated by the presence or absence of a medical diagnosis. N = 619, Figure based on unstandardized coefficients
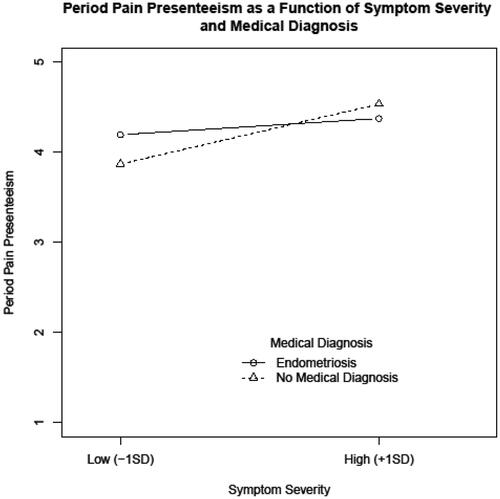
Table 3. Results of models regressing standardized disclosure to leader on the standardized covariates and predictors.
Figure 2. Path analysis Model of associations between the standardized predictors, disclosure to the leader, and period pain presenteeism. N = 668, only significant estimates (p < .05) stated.
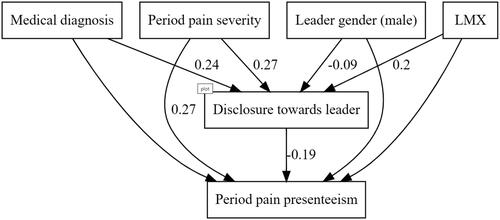
Table 4. Results of the analysis of the indirect associations between the standardized predictors and period pain presenteeism via disclosure to the leader.
Supplemental Material
Download PDF (160.2 KB)Data availability statement
The data that support the findings of this study are openly available in the Open Science Framework at https://osf.io/5j6h8/?view_only=034fda59add448278154dd14eeb106ac (anonymous view-only link for peer-review – will be made publicly accessible after publication).