
Figures & data
Table 1. Descriptive statistics by measurement points.
Figure 1. Cross lagged models of sequential mediation: health anxiety (a)/anxiety sensitivity (b).
Only paths significant at p < .05 and standardized loadings are displayed. Thick lines represent expected regressions, and thin ones reciprocal (R). Full lines represent paths from first to second time point (1-2), and dashed lines paths from second to third (2-3). Variance explained in each variable is shown below it for the second (2)/third (3) time point. Suppressor paths are marked by s.
HA = Health Anxiety: Illness Likelihood (IL), Negative Consequences (NC); AS = Anxiety Sensitivity: Physical (PHY), Cognitive (COG), Social Concerns (SOC); PC = Pregnancy Concerns: Health (HEALTH), Motherhood (MOTHER), Financial (FIN), Concerns about Looks (LOOKS); CYB = Cyberchondria; FOB = Fear of Birth.
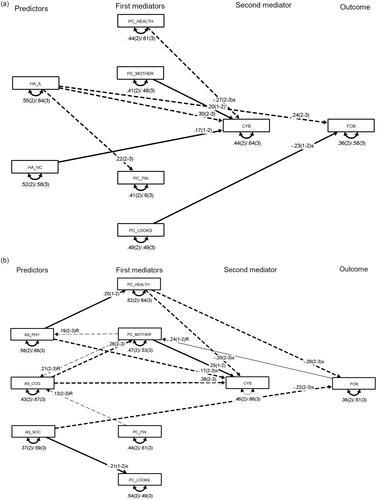
Table 2. Fit and differences between cross lagged models of sequential mediation in three time points (N = 149).
Data availability statement
The data that support the findings of this study are available at Zenodo (doi:10.5281/zenodo.8146859) upon reasonable request.