
Figures & data
Figure 1. The flowchart.
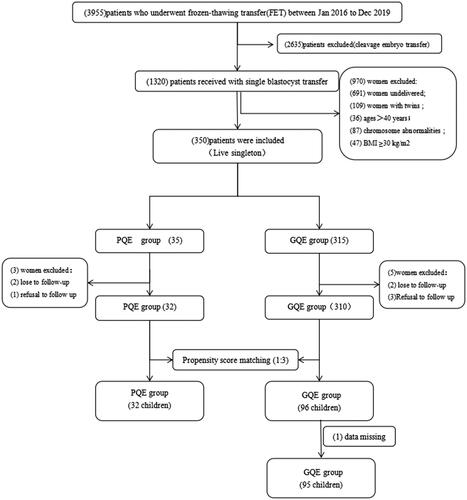
Table 1. Baseline characteristics of patients in two groups (GQE group and PQE group).
Table 2. Clinical characteristics of patients in two groups (GQE group and PQE group).
Table 3. Neonatal outcomes of singleton gestation of patients in two groups (GQE group and PQE group).
Table 4. Children growth and development of patients in two groups (GQE group and PQE group).
Figure 2. Analysis of correlation between the blastocyst quality and the children growth and development (1, 3, 6, 8, 12, 18, 24, 30 and 36 months). Blue is positive correlation, red is negative correlation. The numbers in the squares represent the correlation coefficients (r).
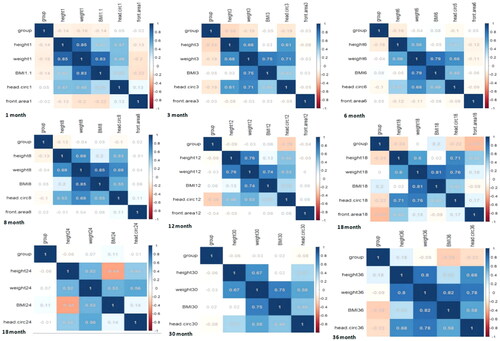
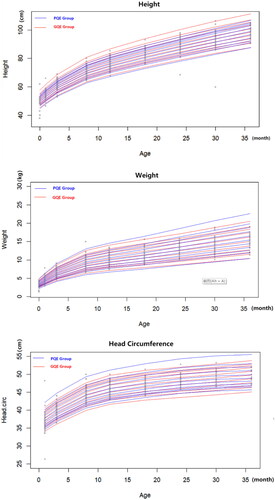
Figure 3. The growth and development speed curve of the children according to the blastocyst quality (GQE and PQE). Children’s growth curve (1, 3, 6, 8, 12, 18, 24, 30 and 36 months) of the height, weight and head circumference in the PQE group and the GQE group. (A) Height, (B) weight and (C) head circumference. The blue line represents PQE group, the red line represents GQE group and the lines from bottom to top represent 3%, 10%, 25%, 50%, 75%, 90% and 97%, respectively. Data are shown as box and whisker plots representing the median, inter quartile range and range.
Data availability statement
The data used during the current study are available from the corresponding author on reasonable request.