
Figures & data
Figure 1. Study subjects of female long COVID patients. Males and females under 18 years of age and over 50 years of age were excluded from the 642 patients with long COVID, and the remaining 223 females with long COVID were analyzed in the present study. Of the 223 female patients, 44 patients had complaints of menstrual symptoms and 179 patients did not have any complaints regarding their menstrual conditions.
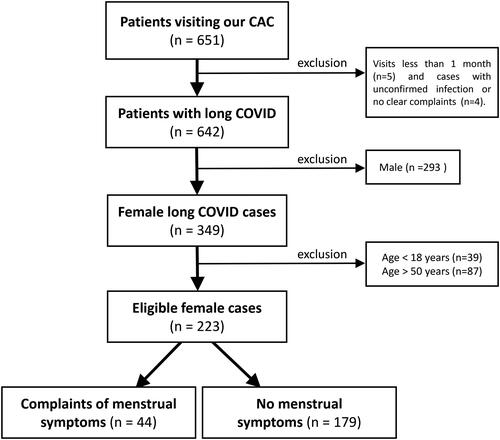
Figure 2. Distribution of ages of female long COVID patients. The black columns indicate the number of eligible female patients (44 patients) who complained of menstrual symptoms, and the gray columns indicate the number of all eligible females (223 cases).
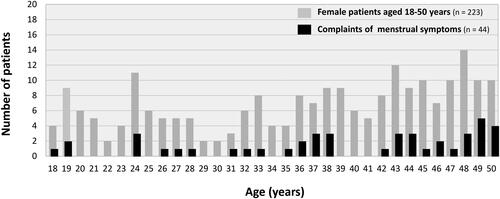
Table 1. Backgrounds of female long COVID patients aged from 18 to 50 years.
Figure 3. Characteristics of female long COVID patients with menstrual symptoms. (A) Variant-dependent changes in patients with menstrual symptoms. The variant rate was calculated by dividing the number of women who complained of menstrual symptoms (4, 6, and 34 cases in each phase) by the total number of women infected with each virus strain (32, 51, and 140 cases in each phase). Virus strains were presumed based on the epidemiological aspects of COVID-19 in Okayama Prefecture, Japan, categorized into three periods: the Preceding phase, before July 18, 2021; the Delta variant phase, spanning from 19 July 2021 to 31 December 2021; and the Omicron variant phase, after 1 January 2022. (B) Detailed symptoms of menstrual abnormalities in long COVID females. The percentages of the major six symptoms in 44 female patients with menstrual symptoms are shown in the columns.
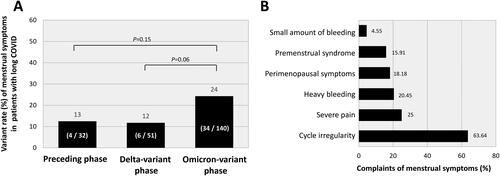
Figure 4. Comparison of the frequencies of major sequelae in long COVID females with and those without menstrual symptoms. The black columns indicate the frequencies of long COVID-related symptoms in patients who had menstrual complaints, and the gray columns indicate the frequencies of symptoms in patients without menstrual symptoms. The data were analyzed by the chi-squared test: **p < 0.01 and *p < 0.05 were considered statistically significant.
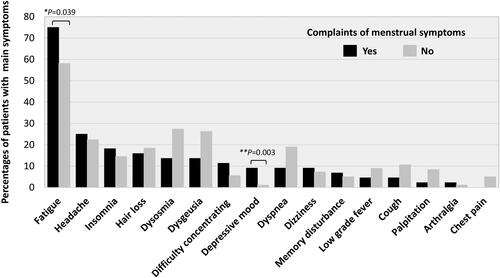
Figure 5. Comparison of self-administered scales for fatigue, quality of life, and depression. FAS: fatigue assessment scale; EQ-5D: Euro QOL 5-dimensions 5-level scores; VAS: visual analog scale; SDS: self-rating depression scale. In each panel, the upper horizontal line of the box represents the 75th percentile, and the lower horizontal line of the box represents the 25th percentile. The horizontal bar within the box is the median, the upper horizontal bar outside the box is the maximum value within 1.5 times the interquartile range, and the lower horizontal bar outside the box is the minimum value within 1.5 times the interquartile range. The data were analyzed by the Mann–Whitney U test: **p < 0.01 and *p < 0.05, statistically significant between the indicated factors (“n” indicates the number of patients).
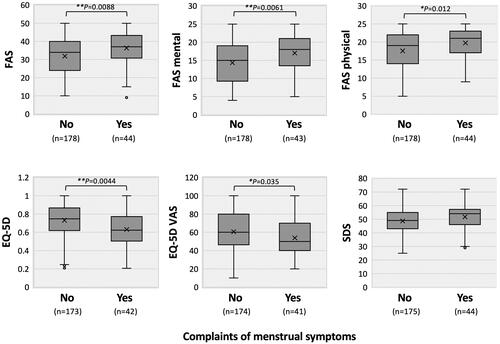
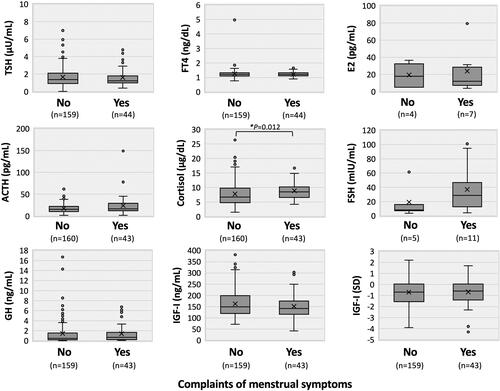
Figure 6. Hormonal trends in female long COVID patients with menstrual symptoms. Circulating levels of thyrotropin (TSH), free thyroxine (FT4), adrenocorticotropin (ACTH), cortisol, growth hormone (GH), insulin-like growth factor (IGF)-I, estradiol (E2), and follicle-stimulating hormone (FSH) are shown in each panel. The context of each panel is shown in the legend of . The data were analyzed by the Mann–Whitney U test: *p < 0.05, statistically significant between the indicated factors (“n” indicates the number of patients).
Data availability statement
Detailed data will be available if requested by the corresponding author.