
Figures & data
Figure 1. A flow chart of study subject recruitment, exclusion and loss of follow-up.
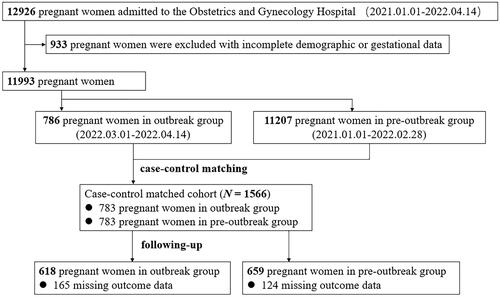
Table 1. Comparison of demographic information and general clinical data of the outbreak group and the pre-outbreak group.
Figure 2. MGM network with the outbreak group (left) and the pre-outbreak group (right). Green edges indicated positive relationships, red edges indicated negative relationships and grey edges indicated relationships involving categorical variables for which no sign is defined. The width of the edges was proportional to the absolute value of the edge-parameter. The colors of the nodes mapped to the different domains Demographics, Clinical, Anxiety and Depression.Note: 3:Marriage_dur: Marriage duration; 4: hus_age: husband’s age; 5: hus_wife_age_diff: age difference between husband and wife; 6: hus_health: health status of the husband; 9: preg_med: Medicines during pregnancy; 10: past_his: past medical history; 11: family_his: family history; 13:preg_fever: fever in pregnancy; 14:preg_risk: pregnancy risk.
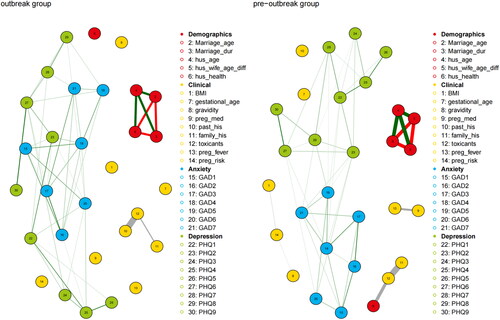
Figure 3. Comorbidity symptoms network of anxiety and depression with the outbreak group (left); bridge centrality index of symptoms network with the outbreak group (right).
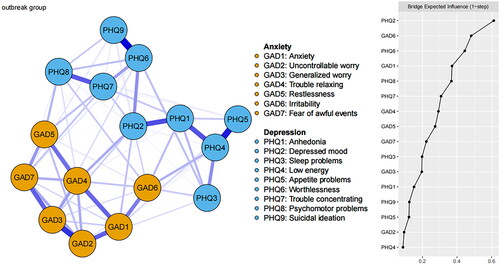
Figure 4. Comorbidity symptoms network of anxiety and depression with the pre-outbreak group (left); bridge centrality index of symptoms network with the pre-outbreak group (right).
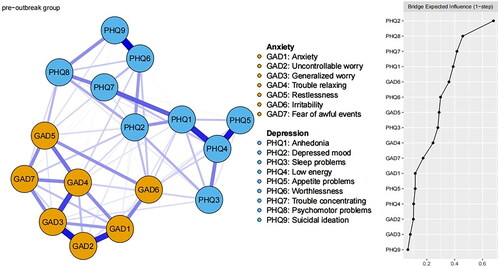
Figure 5. Centrality index of comorbidity symptoms network of anxiety and depression (red: outbreak group; blue: pre-outbreak group).
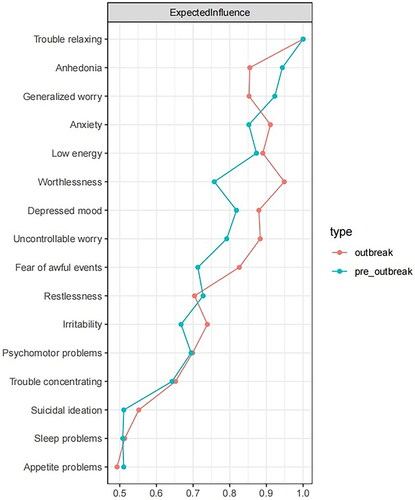
Figure 6. Stability analysis results for expected influence and bridge expected influence in the outbreak group (left) and pre-outbreak group (right). Lines indicate the means and areas indicate the range from the 2.5th quantile to the 97.5th quantile.
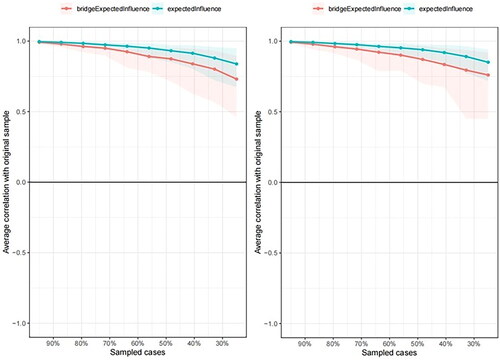
Table 2. Logistic regression results for the levels of depressive and anxious symptoms on gestational and neonatal outcomes for the outbreak group and the pre-outbreak group.