Figures & data
TABLE I Mutant and Wild Type Pineal Rhythm Characteristics
TABLE II per1 Polymorphisms in Zebrafish Strains
Figure 1 The lagdg2 variant is a semi-Dominant, short-period mutant. A. Representative actograms of lagdg2 F2 siblings. The F2 individuals are the progeny of a cross between two heterozygous mutants. The circadian periods of most F2 individuals were categorized as wild type (WT, top), heterozygous (het, middle), or homozygous mutant (hom, bottom), based on the phase of the composite peak produced by averaging the last three cycles. A representative individual is shown for each phenotype. The data were smoothed with a 4 hr moving average and plotted modulo 24.7 h to emphasize period differences. B. Frequency distributions of circadian phases (days 4–6) for progeny of wild type and lagdg2 crosses. Each record was cut modulo 24.7 h; the fourth, fifth and sixth cycles were averaged, and the phase of the resulting peak was measured. Animals from a wild type population (WT), lagdg2 heterozygote outcross (F1), or lagdg2 heterozygote intercross (F2) from a typical experiment.
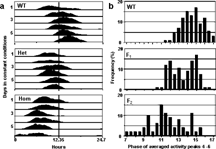
Figure 2 Pineal melatonin-production rhythms from lagdg2 F2 siblings. A. Average (n = 6 in each group) melatonin production from pineal glands isolated from lag homozygotes (lagdg2/lagdg2), lag heterozygotes (lagdg2/ + ), and wild type (+/+) siblings that were cultured at 21°C ± 0.1°C. B. Average periods (± SEM) of wild type (WT), heterozyotes (Het), and homozygous (Hom) rhythms shown in A. C. Average melatonin production from pineal glands isolated from lag homozygotes (lagdg2/lagdg;2 n = 13), lag heterozygotes (lagdg2/ + ; n = 10), and wild type ( + / + ; n = 14) siblings that were cultured at 32°C ± 0.1°C. D. Average periods (±SEM) of wild type (WT), heterozyotes (Het), and homozygous (Hom) rhythms shown in C. All individuals had been previously phenotyped by recording larval behavioral rhythms, as in . Furthermore, the genotypes of the individuals shown in C and D were confirmed using linkage to microsatellite z8604 (see below). White and black bars at the top of each A and C indicate light and dark, respectively. *=p < 0.05, ANOVA, Sheffe's S post-hoc test, from wild type. Periods were estimated as in Figure 3.
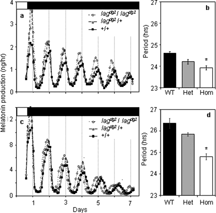
Figure 3 Individual pineal periods at different temperatures. Pineal glands were dissected from our *AB wild type strain (+/+), or a backcrossed homozygous lag mutant line that had been generated by backcrossing to the *AB line for 3 generations (lagdg2/lagdg2). Pineal glands were cultured at the indicated temperatures (±0.1°C) for seven days in constant darkness. Periods were determined using FFT-NLLS for each pineal cultured at each temperature. The period data were fit with linear regressions. The R2 value and slope for lag pineal gland periods were 0.74 and 0.12, respectively. The R2 value and slope for the linear regression lines of wild type pineal periods were 0.89 and 0.22, respectively.
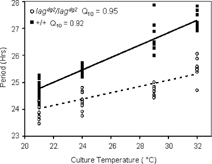
Figure 4 Phase response curves of wild Type and lag pineal glands. Pineal glands from either *AB wild type or our lag backcross line were cultured in constant darkness and 29°C temperature. One-hour white light pulses were administered at the circadian times indicated. PRCs for lag (dashed curve) and wild type (solid curve) pineal glands for average phase shifts at each CT time, with individual CT times and phase shifts are shown. Phase shifts are the difference in phase between light pulsed and control pineal glands (see Materials and Methods for a complete description).
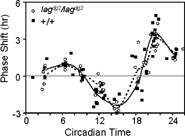
Figure 5 Genetic maps for Linkage Group Seven. Linkage mapping of the lag mutation was performed on a panel of 500 diploid animals. The thick bar indicates the approximate map position of lag. lag is within a 5.1 cM range, 0.6 cM away from z8604. Two point LOD scores between markers are all greater than greater than 70. The relative position of microsatellite markers within the TN54 radiation hybrid map is shown on the right for comparison.
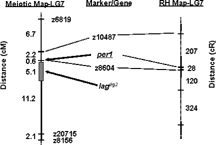
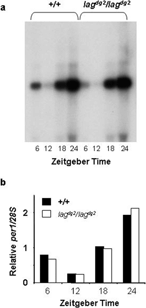
Figure 6 Northern-blot analysis of zebrafish per1. A.Total RNA was isolated from 5–6 day old zebrafish larvae at 6 hour intervals during a light:dark cycle (14:10). Lights on at Zeitgeber Time (ZT) 22, and off at ZT 12. Wild type larvae were of strain *AB, and the homozygous lag larvae were from our backcrossed line. B. The per1 signals were normalized for loading with the 28S, and plotted relative to the average signal for each phenotype, and the average of two independent blots is shown.