Figures & data
Figure 1. Heatmaps from early- and mid-symptomatic G93A SOD1 astroglia show dramatic gene dysregulation. (A) Early onset P60 control vs mutant SOD1 astroglia display differential gene expression, (B) Mid onset P90 control vs mutant SOD1 astroglia display differential gene expression. A total of four mice were used for each time point and all probes being illustrated.
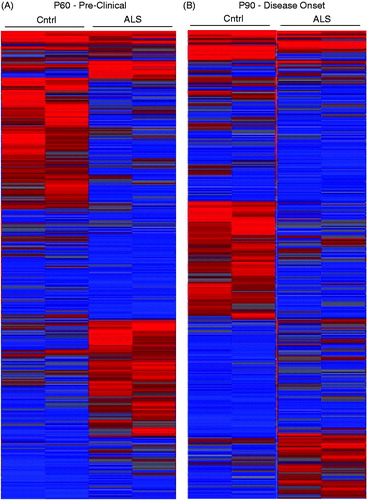
Figure 2. Disease astroglia display a strong trend in genes differentially expressed during disease progression. (A) Correlation plot shows genes most correlated being upregulated and downregulated in control vs mutant SOD1 at both time points. (B) Venn diagram displays each time point of isolated astroglia and time points combined to illustrate genes unique to each and genes showing similar trend of differentiation. A fold change of 1.5 and p values of .05 was used to allow for stringent parameters.
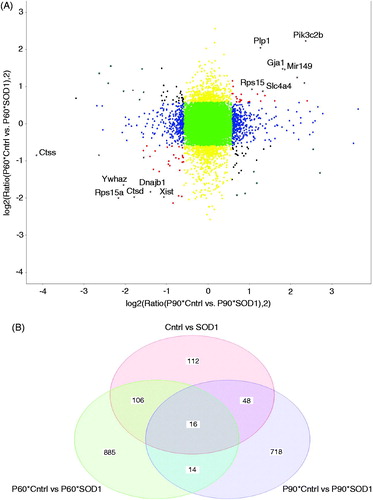
Table 1. Top differentially enriched genes in pre-clinical P60 ALS spinal cord astroglia.
Table 2. Top differentially enriched genes in P90 disease onset ALS spinal cord astroglia.
Table 3. Top differentially regulated pathways in the P60 ALDH1L1-eGFP astroglia from mutant spinal cord compared to the control SOD1 G93A spinal cord.
Table 4. Top differentially regulated pathways in the P90 ALDH1L1-eGFP astroglia from mutant spinal cord compared to the control SOD1 G93A spinal cord.
Figure 3. Cellular compartmentalization shows unique preference at early- and mid-disease onset. (A, B) P60 and P90 showed that the highest amount of hits to be differentially regulated compared to control resided in the cytoplasm and nucleus, respectively. Stringent parameters of fold change of 1.5 and p values of 0.05 was used for this analyses and ingenuity pathway analyses for identification of comparts of top hits.
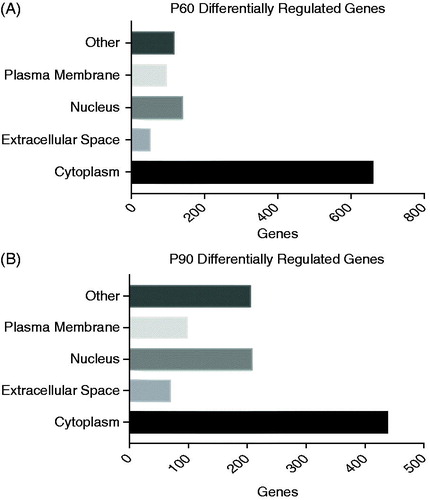
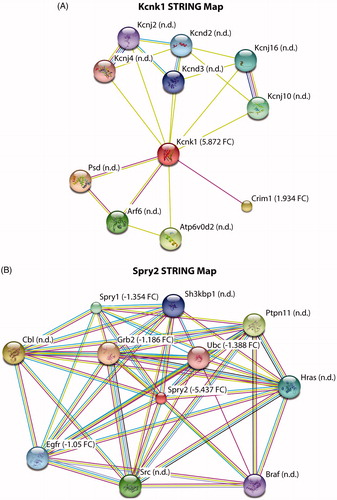
Figure 4. STRING map analysis to determine interacting proteins for highly enriched markers. (A,B) Kcnk1 and Spry2 have several established interacting proteins with some not detected (n.d.) and others detected in our microarray results. Detected proteins are represented by fold-change value (FC ±), control vs mutant SOD1.