Figures & data
Figure 1. Anti-Myc immunohistochemistry revealed expression of PV at the motor terminal (arrow) innervating muscle fiber 5. This single-plane confocal image passes through the central region of the muscle in segment 3. Calibration: 10 µm.
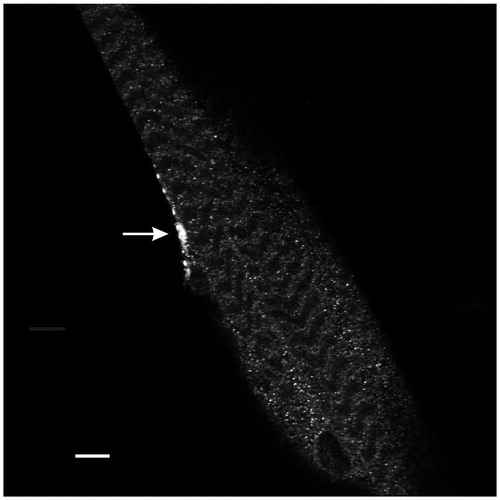
Figure 2. Expression of PV produced a reduction in PPF at the Drosophila NMJ. (A) A semi-log graph of facilitation versus the interpulse interval (ISI). The decay of PPF in CS larvae showed F1 and F2 components of facilitation. A single exponential decay was fit to the data using least-squares regression: F1 = 0.9, decay τ = 46 ms, r2 = 0.66; F2 = 0.3, decay τ = 798 ms, r2 = 0.96. Insert: The first EPSP and superimposed second EPSPs delivered at various ISIs. The vertical ticks at the top show the timing of the first stimulation (large tick) and the second stimulation (small ticks). The broken line shows the amplitude of the first EPSP. (B) PPF in UAS-PV larvae appeared similar to CS. F1 = 0.8, decay τ = 60 ms, r2 = 0.50 and F2 = 0.3, decay τ = 890 ms, r2 = 0.82. (C) For elav/PV larvae, the F1 component of facilitation was nearly absent and could not be fitted by an exponential decay; F2 was reduced. F2 = 0.23, decay τ = 619 ms, r2 = 0.96. (D) The elav/PV facilitation was less than controls at an ISI of 10 ms and an ISI of 200 ms. elav/PV values were compared to CS and UAS-PV values using a one-way ANOVA with a post hoc Bonferroni t-test; *p < .05; ***p < .001.
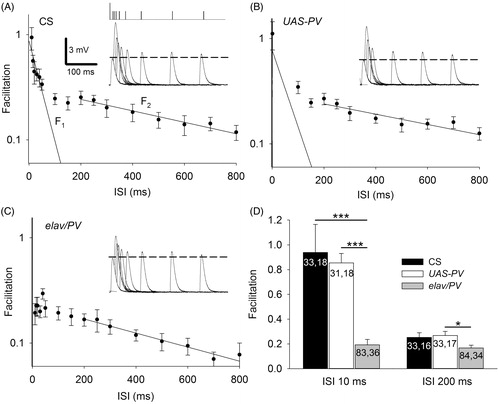
Figure 3. PV-expressing terminals showed less synaptic enhancement during trains of APs delivered at 20 Hz. (A) Representative EPSPs from CS, UAS-PV and elav/PV larvae. Pre-train EPSPs were recorded before the train; Train EPSPs were recorded during the end of the train; and Post-train EPSPs were recorded beginning 1 s after the train. Calibration: 4 mV, 100 ms. (B) EPSP amplitudes were plotted to show the synaptic enhancement during a train. The pre-train EPSP amplitude is shown at 0 s and this was followed by 20 Hz stimulation for 10 s with each value (0.5–10 s) representing the average of 10 EPSPs. The post-train value at 11 s is the average of 20 EPSPs recorded during 0.5 Hz stimulation beginning 1 s after the train. (C) The synaptic enhancement was compared for EPSPs recorded during and after the train. The synaptic enhancement seen during the Train was the percent increase in EPSP amplitude for the final 20 EPSPs; the Post-train synaptic enhancement was determined for the 10 EPSPs recorded after the train. Values for CS and UAS-PV larvae were compared to elav/PV larvae (one-way ANOVA with post hoc Bonferroni t-test; *p < .05, *p < .001). The n values for B are the same as those in C.
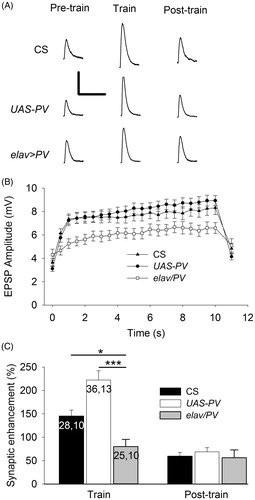
Figure 4. PV-expressing terminals showed greater transmitter release for single APs than the controls. (A) Left: Representative EPSPs produced during 0.5 Hz stimulation. Calibration: 2 mV, 50 ms. Right: EPSP amplitudes for PV-expressing synapses (elav/PV) was significantly greater than those in CS and UAS-PV. (B) Representative mEPSPs recorded from a muscle fiber for each of the three populations. Calibration: 0.75 mV, 0.5 s. (C) Left: There was no significant difference in the mEPSP amplitudes between elav/PV and the controls (p > .10). Right: The mEPSP frequency was significantly greater for PV-expressing synapses compared to UAS-PV and CS. elav/PV was compared to CS and UAS-PV using a one-way ANOVA with a post hoc Bonferroni t-test; **p < .01, ***p < .001.
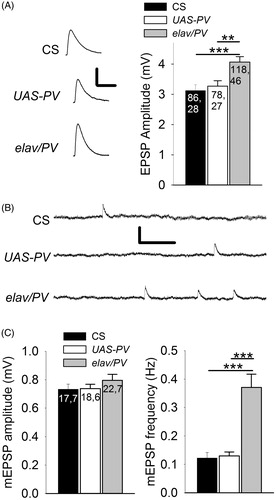
Figure 5. Expression of PV reduced terminal size. (A) Images of muscle fiber 5 motor terminals from UAS-PV and elav/PV larvae visualized with anti-HRP staining. Calibration: 10 µm. (B) Active zones were identified in synaptic boutons using anti-Bruchpilot staining. Calibration: 2 µm. (C) Morphological features of the terminals were compared including terminal length, number of boutons per terminal, bouton width, and the number of active zones (AZ) per bouton. elav/PV was compared to UAS-PV and CS using a one-way ANOVA with a post hoc Bonferroni t-test; *p < .05; ***p < .001.
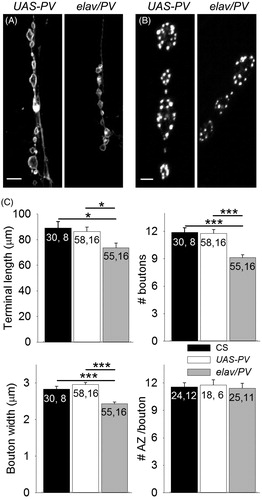
Figure 6. Comparison of the Ca2+ transients produced by single APs and AP trains for elav/PV and UAS-PV boutons. (A) Typical Ca2+ transients for single APs and AP trains seen at these two types of boutons. Calibration: Top: 10% ΔF, 0.2 s; Bottom: 20% ΔF, 2 s. (B) Top: The amplitude of the ΔF was measured at the peak for single APs and at the plateau for AP trains. The Ca2+ transient amplitude for single APs was smaller in elav/PV boutons compared to UAS-PV ones; however, there was no difference in the Ca2+ transient plateau during AP trains for these two groups. Bottom: The ΔF decay τ for elav/PV boutons was smaller for single APs and larger for AP trains compared to UAS-PV boutons. A total of 52 boutons were examined for elav/PV and 48 boutons for UAS-PV. Values for elav/PV compared to UAS-PV using a t-test (*p < .05).
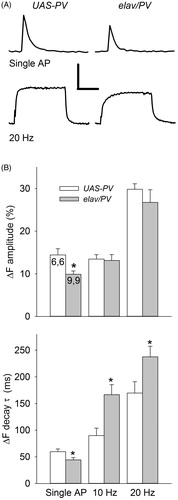
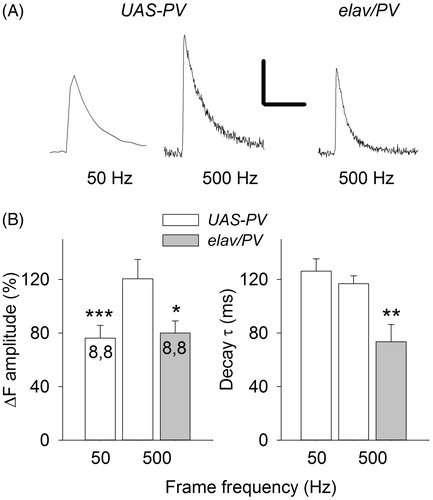
Figure 7. The effect of frame frequency on measurements of single-AP Ca2+ transients. (A) Single-AP Ca2+ transients measured at frame frequency rates of 50 and 500 Hz for a UAS-PV bouton and at 500 Hz for an elav/PV bouton. Calibration: 40% ΔF. 0.2 s, (B) Single-AP Ca2+ transient amplitudes and decay time constants were compared at 50 and 500 Hz frame frequencies for UAS-PV boutons and at 500 Hz for UAS-PV and elav/PV boutons. A paired t-test was used to compare 50 and 500 Hz measurements and a t-test was used to compare UAS-PV and elav/PV measurements at 500 Hz (significantly different from UAS-PV 500 Hz values *p < .05, **p < .01, ***p < .001).