Figures & data
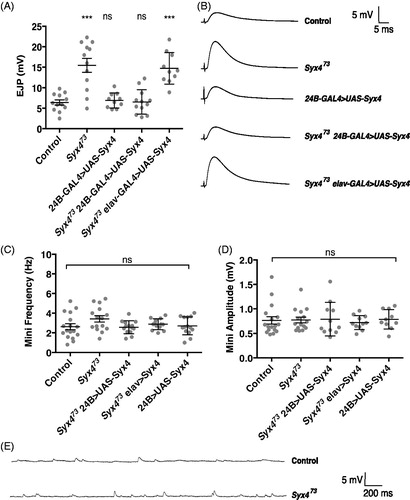
. Syntaxin 4 regulates evoked release. (A) Mean nerve-evoked amplitudes (±SEM, in mV) for the indicated genotypes in HL3 saline containing 0.3 mM Ca2+. (B) Representative traces of nerve-evoked responses for the indicated genotypes. (C) Mean frequency of spontaneous (mini) release (±SEM, in Hz) for the indicated genotypes. (D) Mean amplitude of mini release (±SEM, in mV) for the indicated genotypes. (E) Representative traces of spontaneous release events for control and Syx473 mutants.
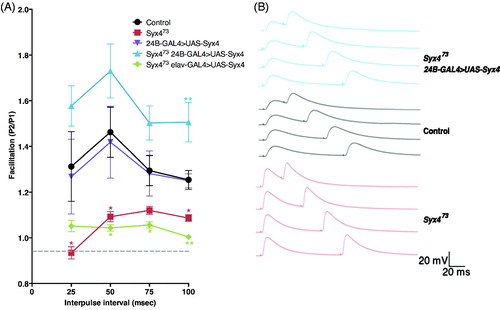
Syntaxin 4 regulates paired pulse facilitation. (A) Mean (±SEM) paired pulse ratio (the second response, P2, divided by the first response, P1) at interpulse intervals of 25, 50, 75, and 100 ms for the indicated genotypes. Recordings were performed in 0.2 mM Ca2+ in HL3.1 saline. (B) Representative traces of paired pulse facilitation. With a 100 ms interpulse interval, resting membrane potential returned to baseline before the second stimulus. Thus, the 100 ms data were used for subsequent analysis and interpretation of PPF values across genotypes.
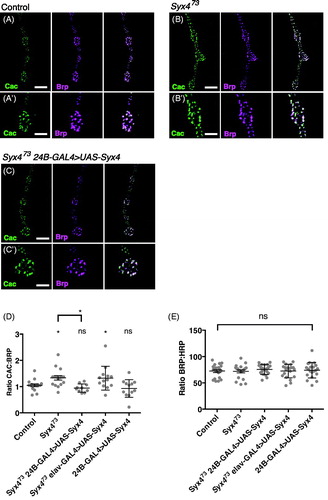
. Syntaxin 4 regulates Cac levels at active zones (A–C) Representative images of Cac-GFP (green) and Brp (magenta) in control animals (A), Syx4 null mutants (B), and Syx4 null mutants expressing Syx4 in the postsynaptic cell (C). (A′–B′) Close-ups of A–C. Scale bars =7 μm (A–C), 3.5 μm (A′–B′). (D) Mean Cac-GFP fluorescence intensity per Brp fluorescence intensity (±SEM) at individual active zones for the indicated genotypes. (E) Mean Brp fluorescence intensity per HRP fluorescence intensity (±SEM) for the indicated genotypes. Mean HRP fluorescence intensity is unchanged across the genotypes used in this study (see Supplemental Table 1).
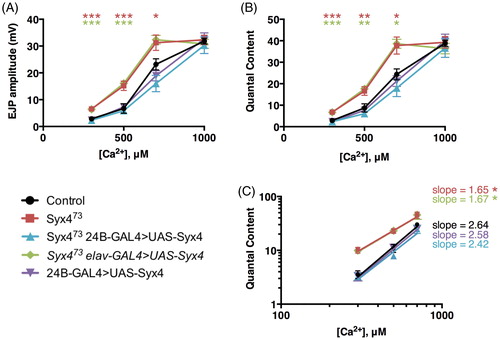
. Syntaxin 4 regulates the Ca2+ cooperativity of neurotransmitter release. (A) Mean EJP amplitude (in mV, ±SEM) at various concentrations of Ca2+ (μM) for the indicated genotypes. (B) Mean corrected quantal content at various concentrations of Ca2+ (μM) for the indicated genotypes. (C) Log–log plot of mean corrected quantal content versus Ca2+ concentration. Slopes were determined from a linear regression of log-transformed data.