
Figures & data
Figure 1. Experiment design to examine effect of parental experience with PA14 on progeny. Schematics for the training procedure and the learning assays.
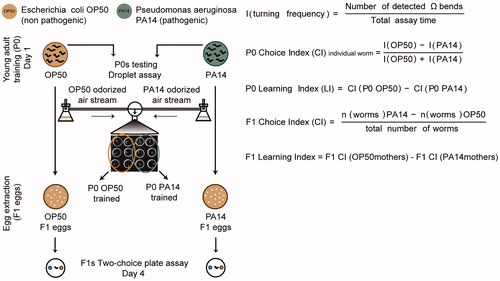
Figure 2. Training with pathogenic PA14 for 4 h increases offspring olfactory preference for PA14, in a small RNA pathway dependent manner. (A,B) Naive wild-type (WT) animals fed on E. coli OP50 (P0 WT OP50) prefer the odorants of PA14 (A), and training with PA14 (P0 WT PA14) decreases the preference (A,B). The deletion mutation rrf-3(pk1426) does not alter PA14 aversive learning in P0 mothers (A,B). n = 9 biological replicates each, droplet assay. (C,D) Progeny of WT trained mothers (F1 WT PA14mothers) show an increased preference for PA14 compared with progeny of WT naive mothers (F1 WT OP50mothers). The rrf-3(pk1426) deletion abolishes this increase (C), which produces a F1 Learning Index different from WT (D). n = 9 biological replicates each, two-choice assay. (E,F) The prg-2(n4358) mothers (P0s) learn to avoid PA14 similarly to WT. Further comparisons also show that CI of P0 WT OP50 is different from CI of P0 prg-2(n4358) OP50 (p < 0.01) and CI of P0 WT PA14 is different from CI of P0 prg-2(n4358) PA14 (p < 0.01). n = 8 biological replicates each, droplet assay. (G,H) The learning experience of P0s does not alter the olfactory preference in prg-2(n4358) F1s (G), which display defective F1 Learning Index in comparison with WT (H), n = 8 biological replicates each, two-choice assay. (I,J) The rrf-3(mg373) and prg-2(tm1094) mutant mothers learn similarly to WT (I, droplet assay) but show a defective F1 Learning Index (J, two-choice assay). n = 8, 6 and 7 biological replicates for WT, rrf-3(mg373) and prg-2(tm1094), respectively. For all, ***p < 0.001, **p < 0.01, *p < 0.05. Data are normally distributed in A, B, D–F, H–J and presented with Mean ± SEM; data are not normally distributed in C, G and presented with box plots (showing median, first and third quartile, whiskers extending to values within 2.7 standard deviations). More details in statistical analyses are in Supplemental Table 1.
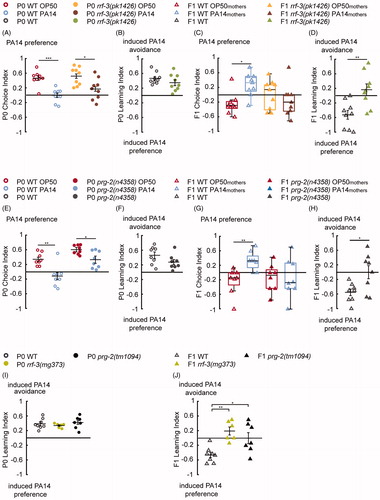
Figure 3. Extending parental training to 8 h switches offspring response from attraction to aversion. (A,B) Training with PA14 for 8 h decreases the preference for PA14 odorants in wild-type (WT) mothers (A), resulting in learned avoidance of PA14 (B), n = 12 biological replicates each, droplet assay. (C,D) The progeny of naive (F1 WT OP50mothers) and trained (F1 WT PA14mothers) mothers show similar preference for the pathogen, n = 12 biological replicates each, two-choice assay. (E) The Learning Index in F1s is linearly correlated with the Learning Index of their mothers after 8-h training. The progeny from the “WT P0 low learning index” group (light green stars) respond to PA14 differently from the progeny from the “WT P0 high learning index” group (dark grey stars). N = 12 biological replicates. (F) Schematics showing the trajectory of a F1 worm in the two-choice plate assay. (G–I) The movement speed (G), reversal rate (H) and the rate of omega bends (I) of F1s from mothers from the “WT P0 low learning index” group (n = 90 worms) and “WT P0 high learning index” group (n = 93 worms). (J) The effect of parental learning on body size of F1 WT OP50mothers (n = 90 worms) in comparison with F1 WT PA14mothers (n = 93 worms). (K) F1s of the trained mothers have similar body size. F1 WT PA14mothers low learning index (n = 45 worms) compared with F1 WT PA14mothers high learning index (n = 48 worms). (L) The F1 learning index is not correlated with the difference in F1 body size, n = 12 biological replicates. For all, ***p < 0.001, *p < 0.05. Data are normally distributed in A–E, G, J and presented with Mean ± SEM; data are not normally distributed in H, I, K and presented with box plots (showing median, first and third quartile, whiskers extending to values within 2.7 standard deviations). More details in statistical analyses are in Supplemental Table 1.
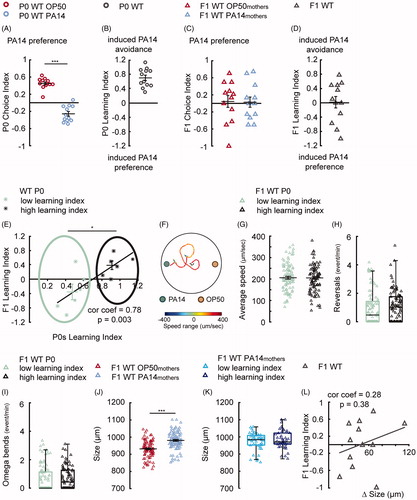
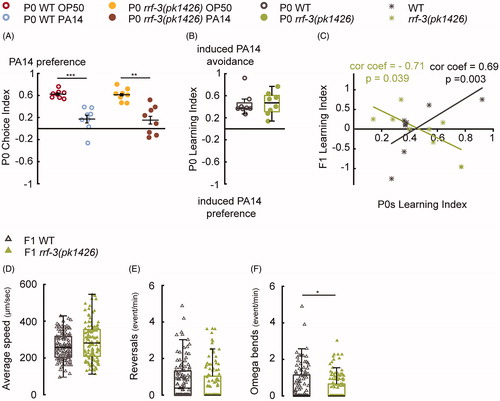
Figure 4. The RRF-3-pathway regulates intergenerational effects generated by 8-h parental training with PA14. (A–C) The rrf-3(pk1426) mutant P0s display wild-type choice indexes (A) and learning (B) after 8-h training with PA14; however, the learning indexes in rrf-3(pk1426) F1s do not positively correlate with their mothers’ learning (C), n = 8 biological replicates for each genotype. P0s and F1s are respectively tested in droplet assay and two-choice assay. (D–F) The movement speed (D), reversal rate (E) and the rate of omega bends (F) in wild-type (WT) F1s (n = 107 worms) and rrf-3(pk1426) F1s (n = 115 worms). For all, ***p < 0.001, **p < 0.01, *p < 0.05. Data are normally distributed in A (Mean ± SEM) and not normally distributed in B, D–F (box plots showing median, first and third quartile, whiskers extending to values within 2.7 standard deviations). More details in statistical analyses are in Supplemental Table 1.
ineg_a_1819265_sm2899.pdf
Download PDF (682.8 KB)Data availability statement
The data and codes supporting this study are accessible in the Harvard Dataverse repository, https://doi.org/10.7910/DVN/UQAYAK