
Figures & data
Figure 1. Spontaneous motor behavior in a circular arena distinguishes dfmr1-mutant from control flies. (A) White-eyed female fly, photographed from above, standing on the wall of an arena, that is, the well of a 96-well plate with an agar-plug floor. All three pairs of legs are visible as indicated by arrowheads: T1, front (prothoracic); T2, middle (mesothoracic); T3, rear (metathoracic). (B, C) Timeline ethograms of dfmr1-control (Ex16/Ex16) and -mutant young adult flies (Δ3/Δ3), respectively, with color legend showing scored behaviors. Each row represents a different fly, with nine representatives of each genotype illustrating the range of variation in grooming behavior; for each genotype, they are arranged from top to bottom by increasing GI. Both controls (B) and mutants (C) show grooming bouts distributed over the entire 15-min test period, with excessive numbers and duration in dfmr1 mutants. In controls, there are minor differences among flies in both grooming parameters, whereas variation among the dfmr1-mutant flies is much greater. Flies of both genotypes spend very little time standing.
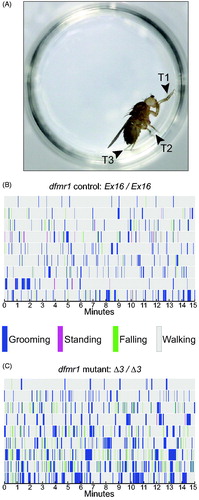
Figure 2. Lack of FMRP causes excessive grooming behavior. Box-plot distributions of data, with the median highlighted by a black arrowhead. Each box represents the interquartile range (i.e. 25th–75th percentiles), whiskers show the spread from 10th (bottom) to 90th (top) percentile. At the dfmr1 locus, all flies were homozygous Ex16 (control) or Δ3 (mutant), compared on the left side of each graph. The right side of each graph shows an independent experiment, comparing Δ3 homozygous mutants with and without the wild-type transgene (P[dfmr1+]) who were siblings from a cross. The number of flies is shown in parentheses above each genotype symbol. (A) The latency to first grooming bout was reduced in mutants compared with controls. Other parameters were increased in the mutants: (B) grooming index, (C) grooming-bout number, and (D) mean grooming-bout duration. Each grooming phenotype was rescued toward control levels by a transgenic copy of wild-type dfmr1 (A–D). Significance levels: *p < 0.05; **p < 0.005; ***p < 0.0005.
![Figure 2. Lack of FMRP causes excessive grooming behavior. Box-plot distributions of data, with the median highlighted by a black arrowhead. Each box represents the interquartile range (i.e. 25th–75th percentiles), whiskers show the spread from 10th (bottom) to 90th (top) percentile. At the dfmr1 locus, all flies were homozygous Ex16 (control) or Δ3 (mutant), compared on the left side of each graph. The right side of each graph shows an independent experiment, comparing Δ3 homozygous mutants with and without the wild-type transgene (P[dfmr1+]) who were siblings from a cross. The number of flies is shown in parentheses above each genotype symbol. (A) The latency to first grooming bout was reduced in mutants compared with controls. Other parameters were increased in the mutants: (B) grooming index, (C) grooming-bout number, and (D) mean grooming-bout duration. Each grooming phenotype was rescued toward control levels by a transgenic copy of wild-type dfmr1 (A–D). Significance levels: *p < 0.05; **p < 0.005; ***p < 0.0005.](/cms/asset/800cf6a8-c289-437f-a1e4-c864a542190a/ineg_a_1833005_f0002_b.jpg)
Figure 3. Non-grooming behavioral metrics in dfmr1-mutant flies. Box-plot distributions of data and dfmr1 genotypes as in . The number of animals is shown in parentheses above each genotype symbol. (A) Walking index was greatly reduced in mutants compared to controls, and rescued by one transgenic copy of wild-type dfmr1. (B) There was no significant difference between dfmr1-mutant and control flies in standing index, and no significant effect of the wild-type transgene in the mutant background. (C) Although mutants showed a large increase in the number of falls, this was not rescued by the wild-type transgene; in fact, it worsened. Therefore, increased falling does not map to dfmr1. Significance levels: *p < 0.05; **p < 0.005; ***p < 0.0005; ns, not significant.
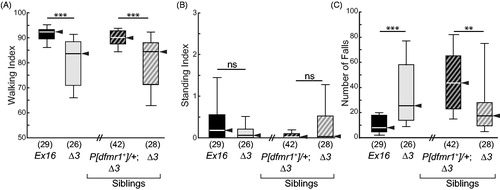
Figure 4. Anatomical distribution of excessive grooming by dfmr1 mutants. (A) Color-coded locations of grooming activity scored. T1, front (prothoracic) legs; T2, middle (mesothoracic) legs; T3 rear (metathoracic) legs. The labels to the right of the color key indicate the legs that typically groom each location. (B) Box-plot distributions of mean number of body parts groomed per bout, displayed as in . Mutants (Δ3 homozygotes) groomed more locations than did their controls (Ex16 homozygotes), and this was rescued by a wild-type dfmr1 transgene, P[dfmr1+]. Significance levels: *p < 0.05; ***p < 0.0005. (C, D) Representative timeline ethograms for grooming only in dfmr1-control (Ex16/Ex16) and -mutant (Δ3/Δ3) flies; ten ethograms for each genotype are arranged from top to bottom by increasing GI. All non-grooming behaviors are depicted as light gray; each grooming bout is color-coded, as in (A). Notice that each fly grooms a variety of locations during the 15-min observation period, but there is much more grooming of posterior structures by the mutants. (E, F) Representative transition-focused ethograms in typical individual dfmr1-control (Ex16/Ex16) and -mutant (Δ3/Δ3) flies. Arrow thicknesses indicate number of transitions to/from particular locations groomed, as well as transitions between grooming and non-grooming behaviors (walk, fall, and stand). Grooming index (GI), number of transitions, number of unique transition types, and the ratio of posterior to anterior grooming are shown below the ethogram for each fly.
![Figure 4. Anatomical distribution of excessive grooming by dfmr1 mutants. (A) Color-coded locations of grooming activity scored. T1, front (prothoracic) legs; T2, middle (mesothoracic) legs; T3 rear (metathoracic) legs. The labels to the right of the color key indicate the legs that typically groom each location. (B) Box-plot distributions of mean number of body parts groomed per bout, displayed as in Figure 2. Mutants (Δ3 homozygotes) groomed more locations than did their controls (Ex16 homozygotes), and this was rescued by a wild-type dfmr1 transgene, P[dfmr1+]. Significance levels: *p < 0.05; ***p < 0.0005. (C, D) Representative timeline ethograms for grooming only in dfmr1-control (Ex16/Ex16) and -mutant (Δ3/Δ3) flies; ten ethograms for each genotype are arranged from top to bottom by increasing GI. All non-grooming behaviors are depicted as light gray; each grooming bout is color-coded, as in (A). Notice that each fly grooms a variety of locations during the 15-min observation period, but there is much more grooming of posterior structures by the mutants. (E, F) Representative transition-focused ethograms in typical individual dfmr1-control (Ex16/Ex16) and -mutant (Δ3/Δ3) flies. Arrow thicknesses indicate number of transitions to/from particular locations groomed, as well as transitions between grooming and non-grooming behaviors (walk, fall, and stand). Grooming index (GI), number of transitions, number of unique transition types, and the ratio of posterior to anterior grooming are shown below the ethogram for each fly.](/cms/asset/97c21296-3be2-4c74-8d71-8ee52da8a539/ineg_a_1833005_f0004_c.jpg)
Figure 5. Analysis of altered behavioral transitions in dfmr1 mutants. (A, B) Ethograms showing the behavioral transitions within grooming bouts (arrows from one body location to another) and between grooming and non-grooming behaviors (walk, fall, and stand). Data for each genotype have been pooled and arrow thickness represents transition frequency (cf., ). (A) Genetic controls (Ex16/Ex16, n = 29); (B) dfmr1 mutants (Δ3/Δ3, n = 26). (C) Box-plot distributions of the number of unique grooming-related transition types; data and genotypes displayed as in . The dfmr1-mutant flies (Δ3/Δ3 in both experiments) showed significantly elevated transition-type numbers, which returned to control levels in the presence of one copy of the wild-type dfrm1 transgene. Significance level: ***p < 0.0005.
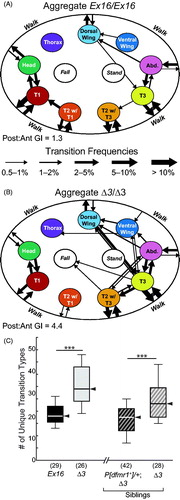
Figure 6. Patterned grooming in dfmr1-mutant flies. Box-plot distributions of data, displayed as in . All nine panels reflect data from the same four groups, as detailed in the x-axis labels of panels (A), (B) and (C). (A) Total within-bout transitions between grooming sites are increased in dfmr1 mutants (Δ3/Δ3), and rescued by a single copy of the dfmr1+ transgene. (B) Within-bout ABA-type patterned grooming was increased in dfmr1 mutants (Δ3/Δ3), and rescued by one copy of the wild-type dfmr1+ transgene. This increase persisted when total transition number was normalized by mean grooming-bout duration. (C) Between-bout X-Stop-X-type repetitive grooming was elevated in dfmr1-mutant flies, and rescued by the dfmr1+ transgene. (D) Total within-bout transitions remained elevated in dfmr1 mutants when normalized by mean grooming-bout duration; this increase was rescued by providing the dfmr1+ transgene. (E) The number of ABA repeats remained elevated in dfmr1 mutants when normalized by mean grooming-bout duration; this increase was rescued by providing the dfmr1+ transgene. (F) When normalized by grooming-bout number, X-Stop-X repeats were more similar between genotypes, but remained significantly increased in the dfmr1 mutants. (G) Three-location grooming transitions, AB(nonA), were increased in dfmr1 mutants and rescued by the wild-type transgene. (H) The increase in AB(nonA) persisted after normalization by mean grooming-bout duration, and was rescued by the wild-type transgene. (I) The ratio of ABA to total transitions was not statistically significantly different among the four genotypes. Significance levels: *p < 0.05; ***p < 0.0005; ns: not significant.
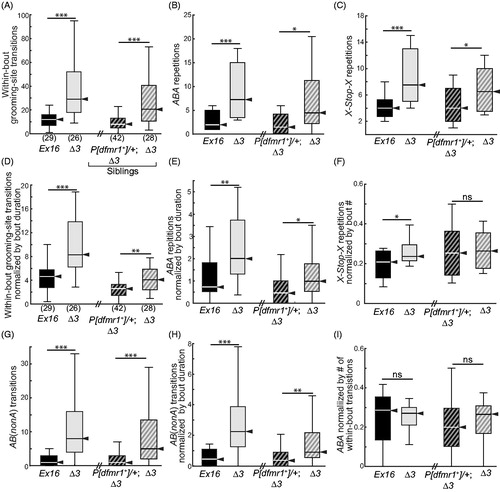
Figure 7. Spontaneous motor-behavior in CASK mutants reveals increased grooming, stationery bouts, and behavioral activation. (A, B) Timeline ethograms, similar to those in , with the addition of tumbling and twitch to the repertoire of mutually exclusive behaviors; for each genotype, they are arranged from top to bottom by increasing GI. Thin dotted lines at the end of 4 min highlight differences in behavior between the introductory period (0–4 min) and the test period (5–15 min). (A) CASK-control flies (Ex33/Ex33) spend most of their time walking, with no apparent differences across the 15-min observation period. (B) CASK-mutant flies (Δ18/Δ18) show markedly increased standing behavior, especially after 4 min. (C–F) Genotype-dependent changes in motor-behavior metrics between 4-min introductory and 11-min test periods for standing index (SI), walking index (WI), grooming index (GI) and grooming-bout duration. Each circle represents a single fly: homozygous CASK Ex33 controls (open circles, n = 20) and homozygous CASK Δ18 mutants (gray-filled circles, n = 20). For a given metric, the change was calculated by subtracting each fly’s value for the 11-min test period from the value for the 4-min introductory period. For control flies, the median values of all four parameter changes were close to zero. (See also Figure S7 for direct comparisons of the two time periods in each genotype). (C) CASK-mutant flies showed a marked increase in SI during the test period, whereas control animals displayed no change. (D) WI of mutant flies was substantially decreased compared with that of controls. (E) The change in GI did not differ significantly between the two genotypes. (F) Grooming-bout duration increased markedly in CASK mutants, but not in control flies, after the introductory period. Significance levels: ***p < 0.0005; ns: not significant.
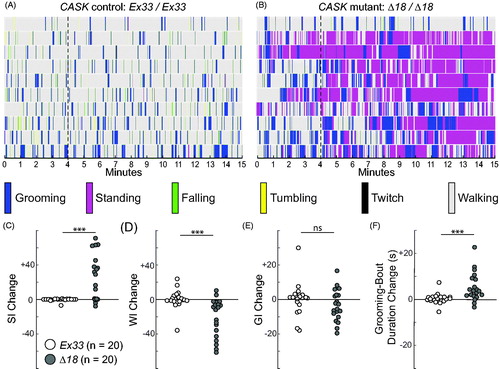
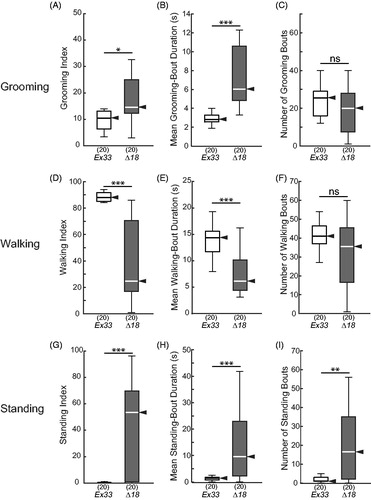
Figure 8. Elevated grooming and standing in CASK-mutant flies. Box-plot distributions of data from 15-min observation periods, as in , for CASK-control (Ex33/Ex33) and CASK-mutant (Δ18/Δ18) flies. (A) CASK mutants groomed significantly more than did control flies. (B, C) The elevated GI was due to a significant increase in the mean grooming-bout duration (B) and not due to an increase in grooming-bout number (C). (D) Walking was greatly reduced in CASK mutants, not because of a reduction in walking-bout number (F), but because those bouts were significantly shorter (E). (G) Standing index, conversely, was increased dramatically in CASK mutants, with both (H) standing-bout duration and (I) the number of standing bouts markedly elevated. Significance levels: *p < 0.05; **p < 0.005; ***p < 0.0005; ns: not significant.
Supplemental Material
Download PDF (3 MB)Data Availability Statement
Supplemental videos 1-4 may be viewed at https://arizona.box.com/s/xc1k6l2xfz8a222v5o5u24fbijcb1ggr