Figures & data
Figure 1. A cross section of a WTB with the bonded joints highlighted.
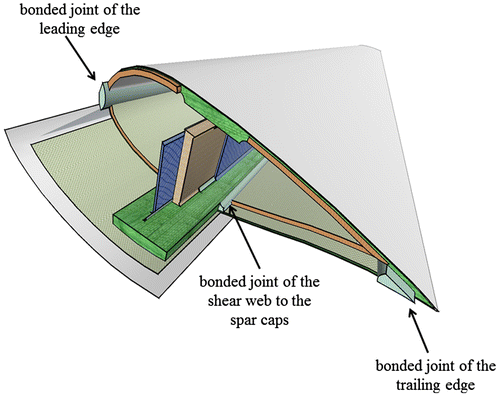
Figure 2. The curing process of the tubes.
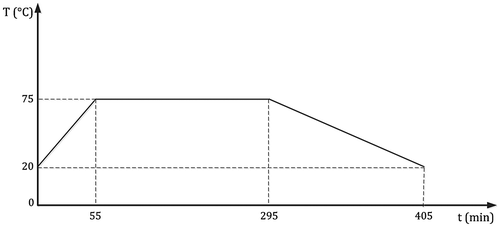
Figure 3. The adhesive tubular specimens.
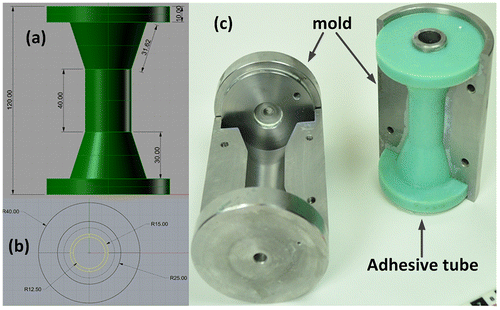
Figure 4. The experimental set-up.
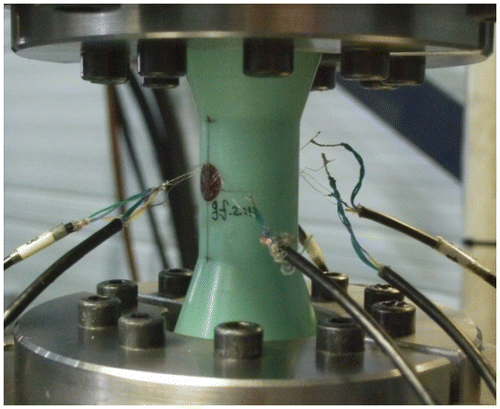
Table 1. The tensile elastic properties of the adhesive tube.[Citation18]
Table 2. The compressive elastic properties of the adhesive tube.[Citation18]
Table 3. The shear elastic properties of the adhesive tube.[Citation18]
Table 4. The biaxial failure loads and stress.
Figure 5. The tension stress–strain response for the biaxial ratios.
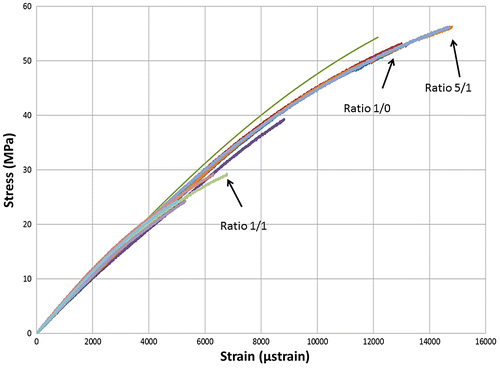
Figure 6. The compression stress–strain response for the biaxial ratios.
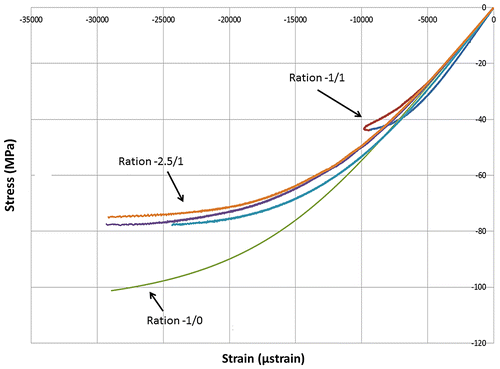
Figure 7. The shear stress–strain response for the biaxial ratios.
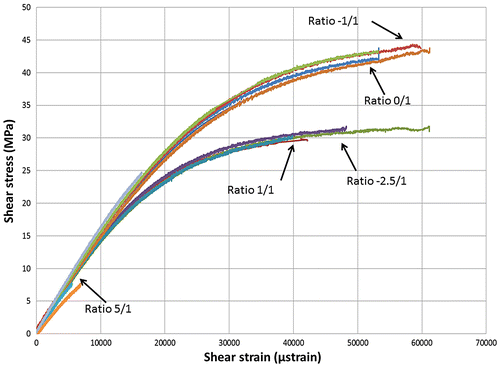
Table 5. The model parameters for different biaxial stress ratios.
Figure 8. Compression modulus degradation as a function of the stress level for the biaxial ratios.
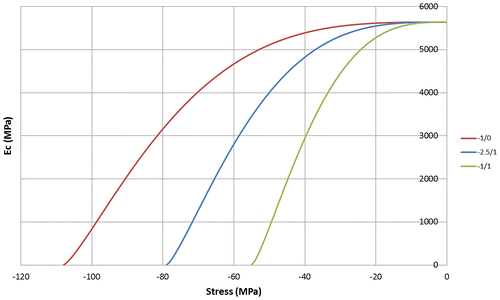
Figure 9. Shear modulus degradation as a function of the stress level for the biaxial ratios.
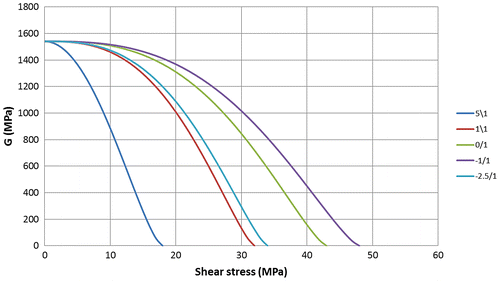
Table 6. Degraded elastic properties of the adhesive.
Table 7. Failure experimental and numerical stresses.
Figure 10. The flowchart of the progressive damage scenario.
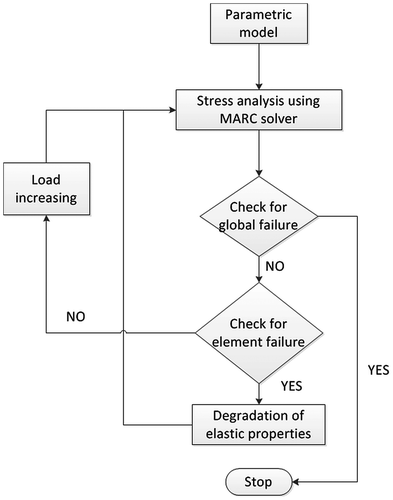
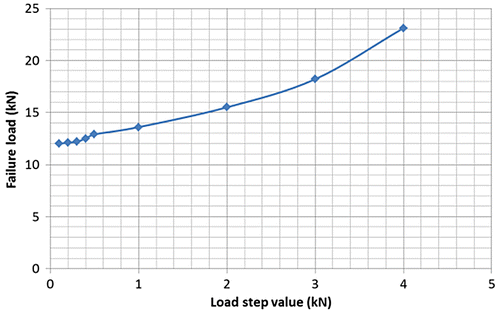
Figure 12. Comparison between the experimental observations and numerical results for the 1/0 loading ratio (uniaxial tension).
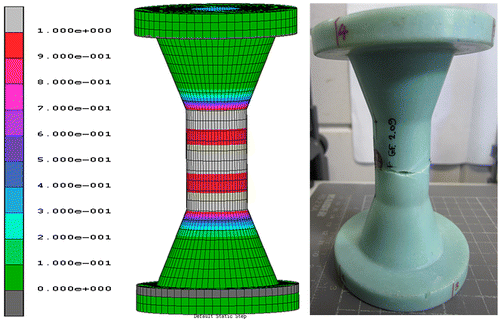
Figure 13. Comparison between the experimental observations and numerical results for the 5/1 loading ratio (biaxial tension–torsion).
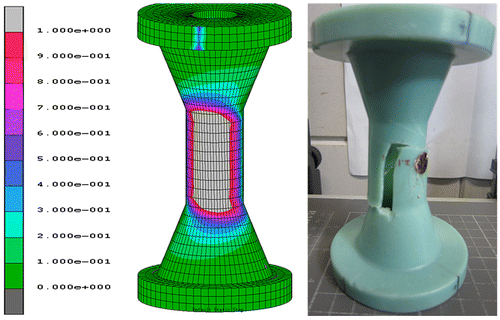
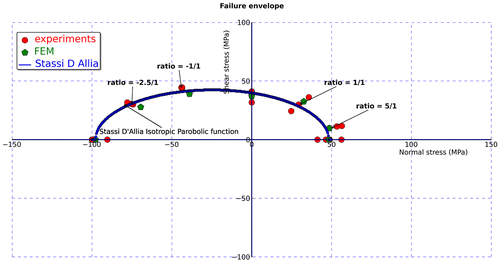
Figure 14. The biaxial failure envelope.