
Figures & data
Scheme 1. Synthesis of 3-cyclopropyl-3,4-dihydroquinazolin-2(1H)-one (CPHQ) (4)
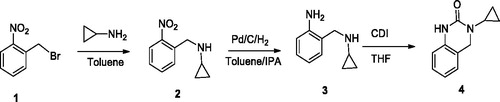
Figure 1. Polarization curves of carbon steel in the aggressive solution in the absence and presence of different concentrations of CPHQ at 303 K.
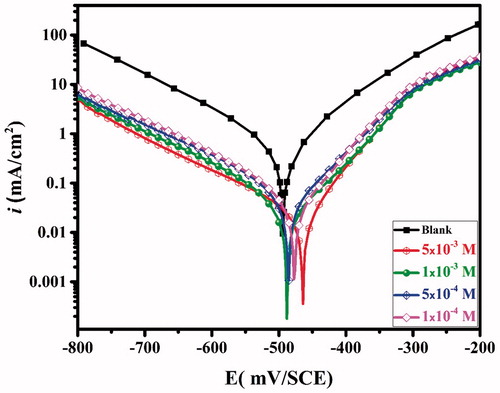
Table 1. PDP parameters of carbon steel in 1.0 M HCl solution without and with different concentrations of CPHQ inhibitor and the corresponding inhibition efficiency at 303 K.
Figure 2. Nyquist plots recorded for carbon steel in 1.0 M HCl solutions without and with different concentrations of the inhibitor CPHQ at 303 K.
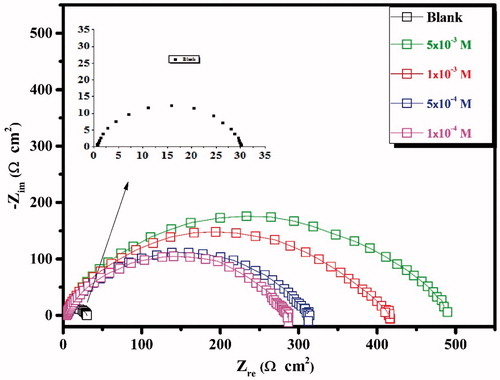
Figure 3. Bode impedance plots and phase angle plots recorded for carbon steel without and with various concentrations of CPHQ at 303 K.
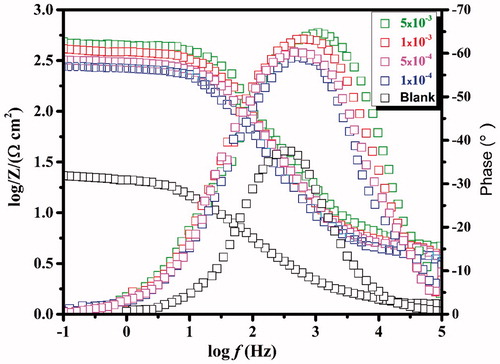
Figure 4. Equivalent electrical circuit used to fit the EIS data.
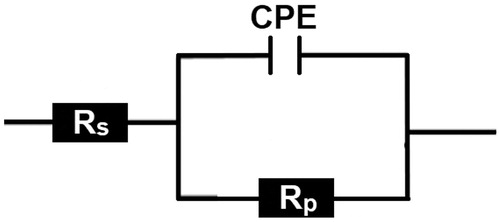
Table 2. Impedance parameters for the corrosion of carbon steel in 1.0 M HCl solution containing CPHQ at 303 K.
Table 3. Weight loss data of different concentrations of CPHQ in 1.0 M HCl solution at 303K.
Figure 5. The variation of the inhibition efficiency derived from electrochemical and weight loss methods as a function of the concentration of the inhibitor.
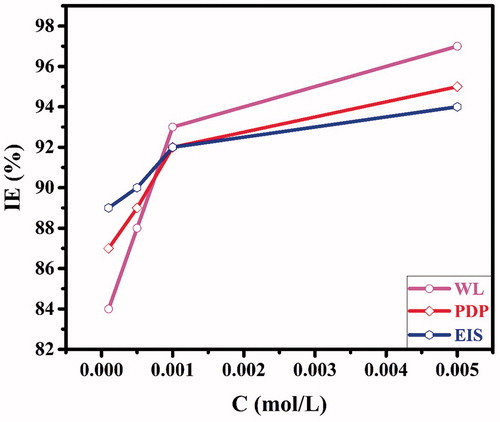
Table 4. The adsorption parameters for the corrosion of carbon steel in 1.0 M HCl with CPHQ at 303 K.
Figure 6. Plots of the Langmuir adsorption isotherm of the CPHQ on the carbon steel surface at 303 K.
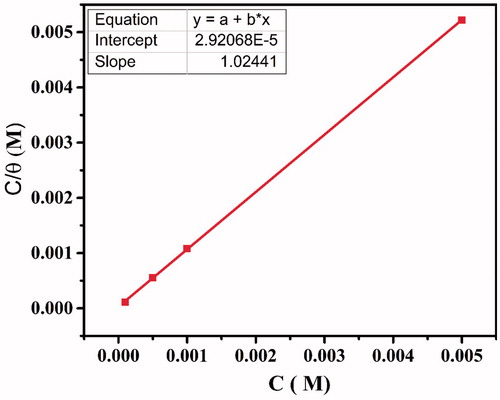
Figure 7. Potentiodynamic polarization curves of carbon steel in (a) 1.0 M HCl and in (b) 1.0 M HCl + 5 × 10⁻³ M of CPHQ at different temperatures.
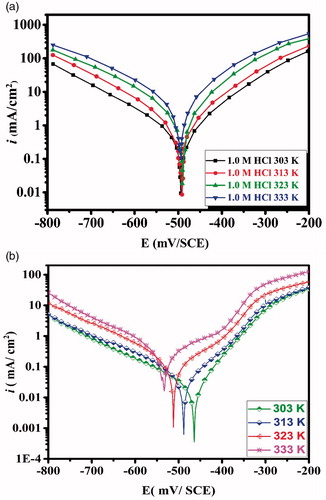
Table 5. Effect of temperature on electrochemical parameters of the corrosion of CS in 1.0 M HCl in the absence and presence of 5 × 10⁻³ M of CPHQ.
Figure 8. (a) Arrhenius and (b) transition state plots for carbon steel in 1.0 M HCl and 1.0 M HCl + 5 × 10⁻³ M of CPHQ at different temperatures.
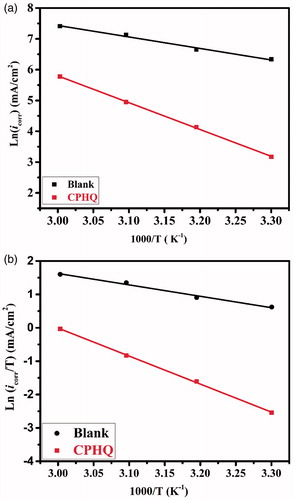
Table 6. Corrosion kinetic parameters for carbon steel in 1.0 M HCl in the presence and absence of 5 × 10⁻³ M of CPHQ.
Figure 9. SEM images of CS surface in absence and presence of tested inhibitor at 5 × 10⁻³ concentration after 6 h of immersion time at 303 K.
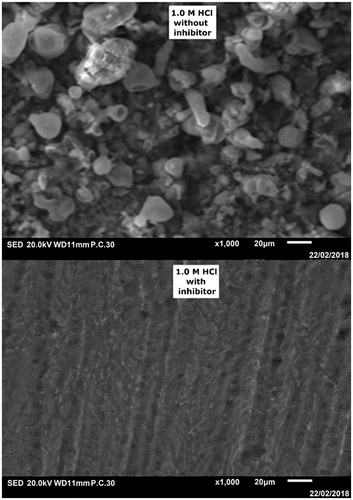
Figure 10. The optimized molecular structure and frontier orbitals distribution (HOMO and LUMO) of CPHQ molecule calculated at B3LYP/6-31G (d, p).
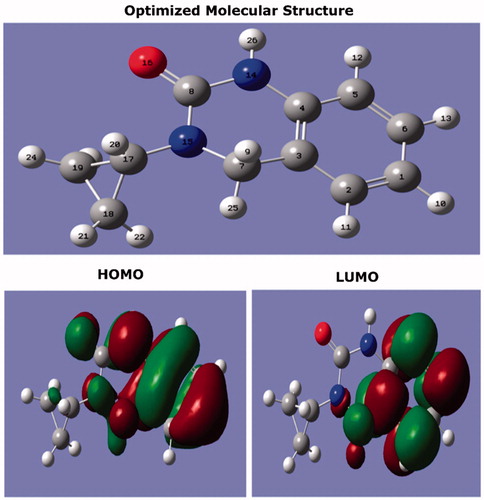
Table 7. The quantum chemical parameters of CPHQ calculated using DFT at B3LYP/6-31G (d, p).
Figure 11. The optimized molecular structure with (a) Mulliken charge and (b) MEP of CPHQ calculated at B3LYP/6-31G (d, p).
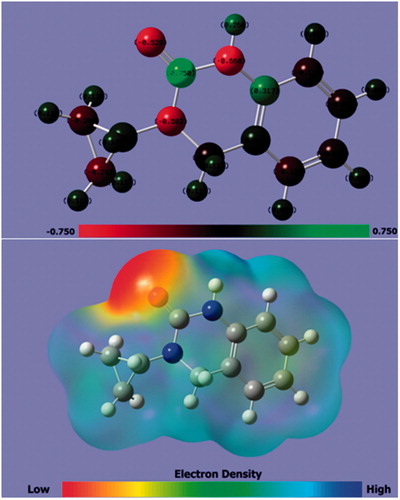
Figure 12. Stable configurations for the adsorption of CPHQ on Fe(110) surface obtained from MD simulations.
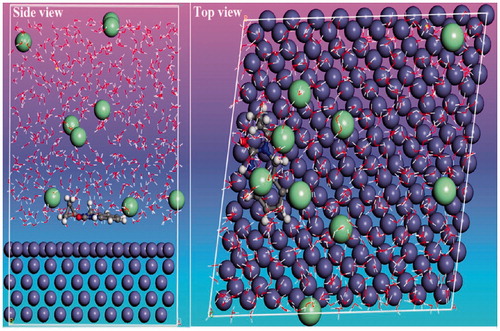
Table 8. Interaction and binding energies obtained from MD simulations for adsorption of CPHQ on the iron surface.