Figures & data
Figure 1. Flow-chart showing experimental sequence and allocation of groups regarding combinations of the adhesives and surface treatments.
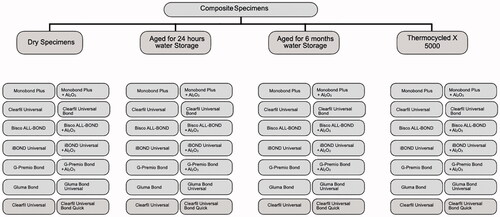
Table 1. Brands, abbreviations, manufacturers and chemical compositions of the materials used in this study.
Table 2. The mean shear bond strength values (MPa) of all experimental groups.
Figure 2. The mean shear bond strength values (MPa) of all groups as a function of aging procedures and adhesive systems.
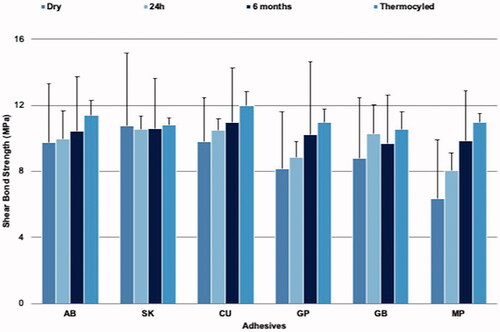
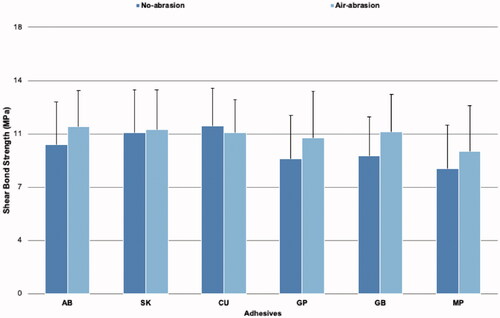
Figure 3. The mean shear bond strength values (MPa) of all groups as a function of surface conditioning and adhesive systems.