Figures & data
Table 1. Overview of the welding parameters used in this study for the welding experiments with native spruce, kraft lignin modified spruce and spruce modified with different biomolecules (different lignins, tannic acid and citric acid).
Figure 1. Influence of welding pressure and welding frequency on the mean tensile shear strength of unmodified spruce after (A) conditioning at 65% r.h. and (B) after 24 h water immersion. The error bars denote the standard error of the mean (SE). Please note the different scaling of the axes.
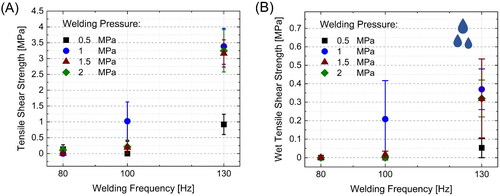
Figure 2. Tensile shear strength of kraft lignin treated spruce in (A) dry state and (B) after 24 h water immersion. Shown are welded spruce modified with different amounts of kraft lignin (1 or 2 g per specimen) and welded with a frequency of 100 or 130 Hz and a welding pressure of 1.5 MPa. The displacement (1 or 2 mm) was used as stop criteria. Please note the different scaling of the axes.
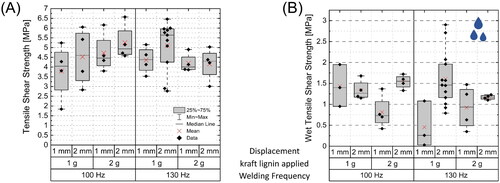
Figure 3. FTIR-ATR spectra of the modified lignins used as bonding additive for the welding, with proposed molecular structures of the modification of softwood kraft lignin. Exemplary shown is the β-aryl ether substructure of lignin. For depolymerisation, only some potential structures are depicted with no claim for completeness. A selection of characteristic absorption bands of the functional groups and their corresponding structural representations are denoted by the letters A–C.
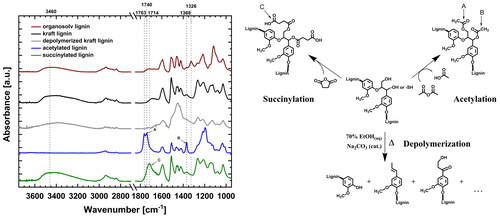
Table 2. Quantification of the hydroxyl groups of the modified lignins and tannic acid, determined by 31P NMR.
Table 3. Molecular weight distribution of kraft and organosolv lignin measured by GPC.
Figure 4. (A) TGA data of the biopolymers used as welding modifications. (B) DSC thermogram with the glass-transition temperature of lignin. (C) Structures of the char after pyrolysis to 500 °C under N2.
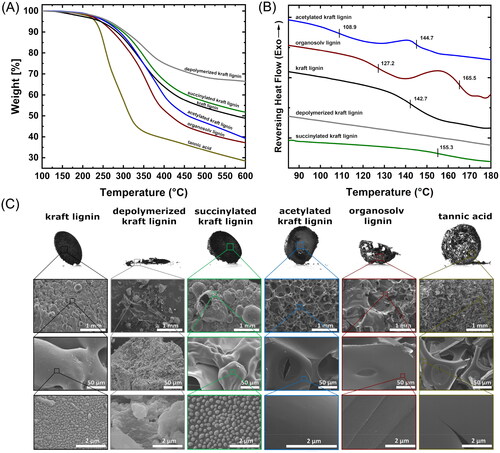
Figure 5. (A) Sample preparation for tensile shear tests with: (1) surface modification, (2) welding, (3) cutting of the welded sample into shear tests specimen and (4) finished tensile shear test specimen. The tensile shear strengths of friction welded spruce with different modifications are shown in (B) dry state at a moisture content of ≈12% and (C) wet state after 24 h water immersion. Significant differences from the control samples (p < .05) are marked with an asterisk. Please note the different scaling of the axes.
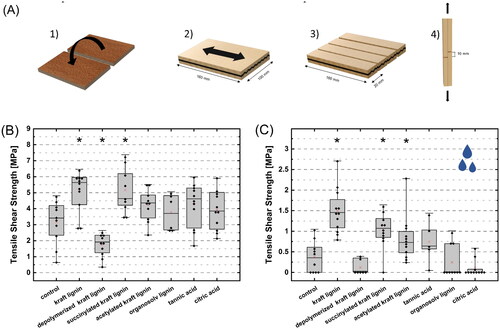
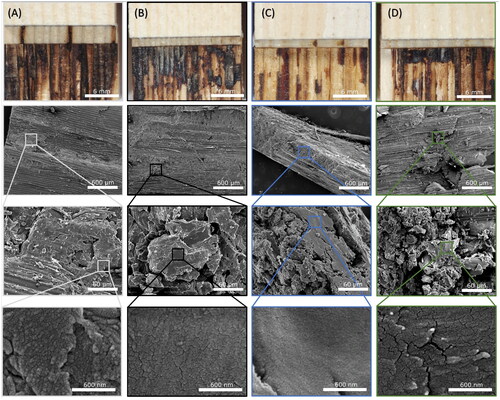
Figure 6. Photography of the shear surface and SEM images of sections of the welded surface of lignin-treated spruce after tensile shear tests. (A) Untreated control, (B) kraft lignin, (C) acetylated kraft lignin and (D) succinylated kraft lignin.