
Figures & data
Figure 1. The VBS molecule’s sugar groups (glucose and rhamnose) and two antioxidants (phenylpropanoid and phenylethanoid) linked through an ester and glycosidic linkages.
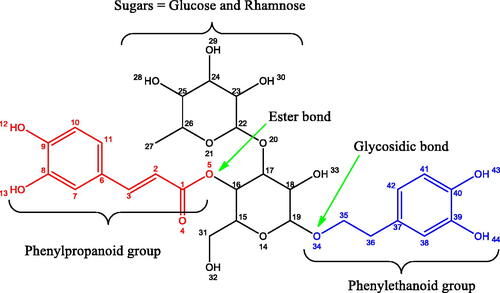
Figure 2. OCP curves obtained for the uninhibited and ALJPE-inhibited (200–800 ppm) Al sample in 1 M HCl.
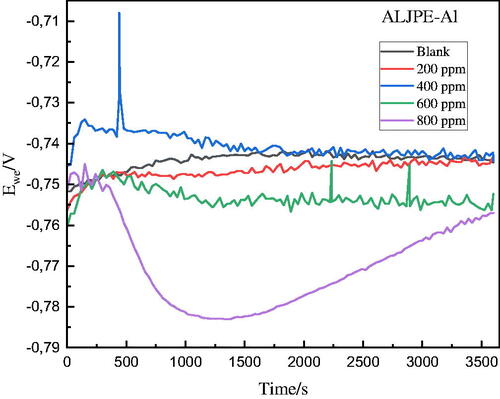
Figure 3. Tafel extrapolation using EC − Lab software for the uninhibited Al sample immersed in 1 M HCl solution.
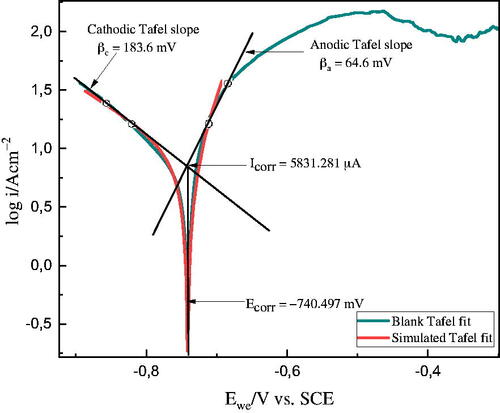
Figure 4. PDP-Tafel plots for the uninhibited and ALJPE-inhibited (200–800 ppm) Al system in 1 M HCl at 303 K.
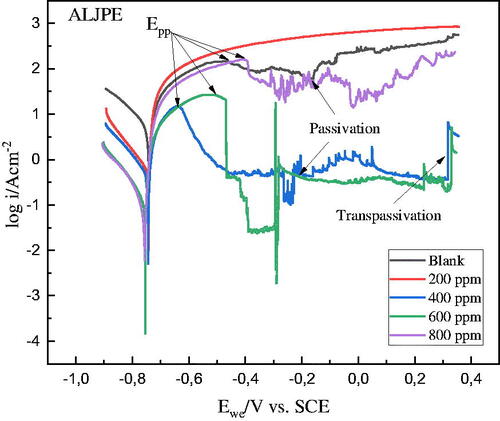
Table 1. PDP parameters for the uninhibited and ALJPE-inhibited Al system.
Figure 5. EIS-Nyquist (a) and Bode (b) plots for the uninhibited and ALJPE-inhibited (200–800 ppm) Al system in 1 M HCl at 303 K.
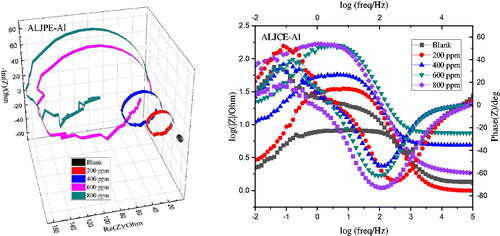
Figure 6. Equivalent circuit for simulating the EIS data with a focus on the uninhibited corrosive Al system (1 M HCl).
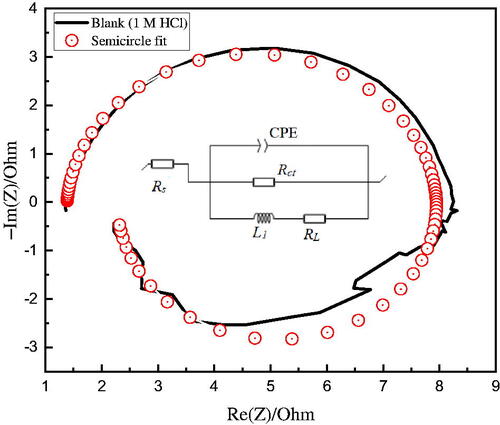
Table 2. EIS parameters for the uninhibited and ALJPE-inhibited Al system.
Figure 7. The dependence of (a) IE(%) (solid lines) and (b) CR (dashed lines) on the concentration of ALJPE after 7 h of immersion of Al samples in 1 M HCl at different temperatures.
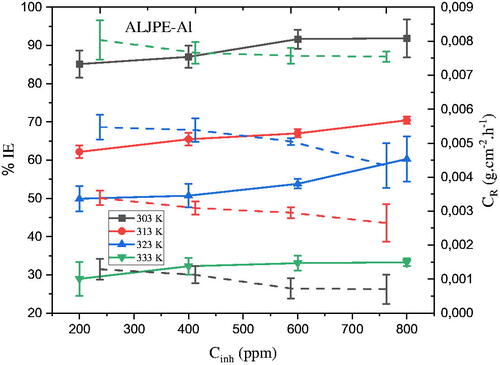
Table 3. Gravimetric parameters for the uninhibited and ALJPE-inhibited Al system in 1 M HCl corrosive solution at 303–333 K.
Figure 8. Variations in %IE from gravimetric analysis with immersion time for 800 ppm ALJPE at 303 K.
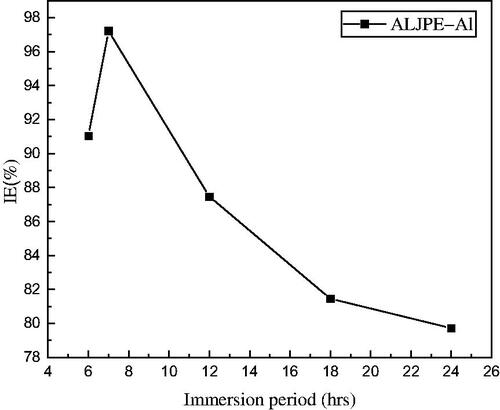
Figure 9. The dependence of (a) IE(%) (solid lines) and (b) CR (dashed lines) on temperature after 7 h of immersion of Al samples in 1 M HCl at different ALJPE concentrations.
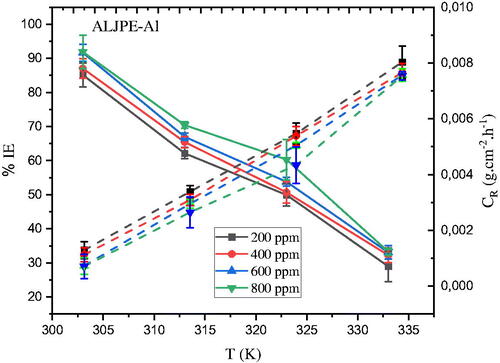
Figure 10. Arrhenius (a) and Transition (b) state diagrams for the uninhibited (blank) and ALJPE-inhibited (200–800 ppm) Al system in corrosive 1 M HCl solution.
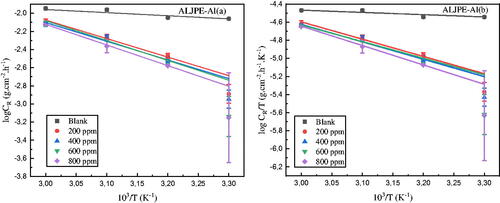
Table 4. Gravimetric parameters for the uninhibited and ALJPE-inhibited Al system in 1 M HCl corrosive solution at 303–333 K.
Table 5. Comparison of IE(%) for Al obtained by gravimetry in this work with literature.
Figure 11. Gravimetric (a), EIS, and PDP (b) Langmuir adsorption isotherms for Al system with different concentrations of ALJPE in corrosive 1 M HCl solution.
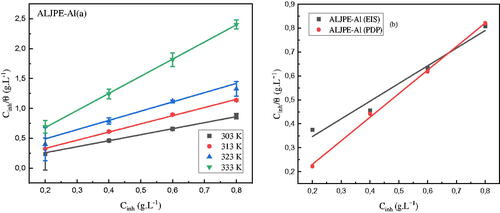
Table 6. Gravimetric, EIS, and PDP Langmuir adsorption isotherm parameters for ALJPE-inhibited Al system in 1 M HCl corrosive solution at different temperatures.
Table 7. The KL values for various concentrations of ALJPE at 303 to 333 K from gravimetric Langmuir isotherm parameters.
Figure 12. Different adsorption geometries of the VBS molecules (VBS 1–4) on the Al(111) surface.
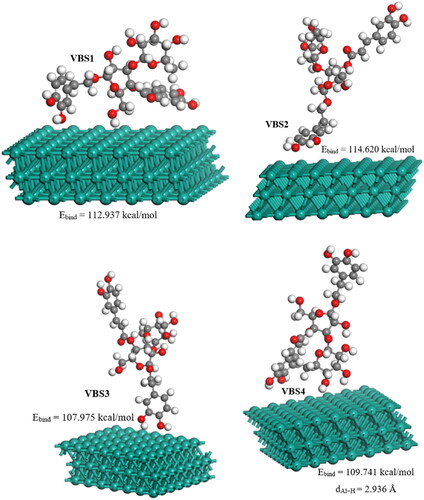
Table 8. Calculated optimized energies for stable VBS adsorption sites on Al(111) surface.
Figure 13. Possible interaction mechanism of ALJPE with the Al surface in corrosive HCl solution.
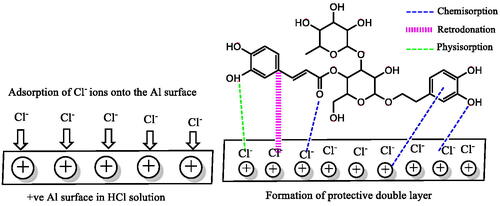
Figure 14. Contact angles for the untreated Al substrate (a), Al substrate when immersed in uninhibited (b), and ALJPE-inhibited (c) 1 M HCl medium for 7 h.
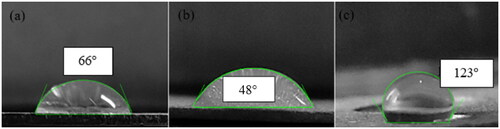
Figure 15. UV-vis spectra for 1 M HCl solution with ALJPE before immersion of Al sample (HCl + ALJPE), after immersion (HCl + ALJPE–Al3+), and the sample without ALJPE (HCl + Al3+).
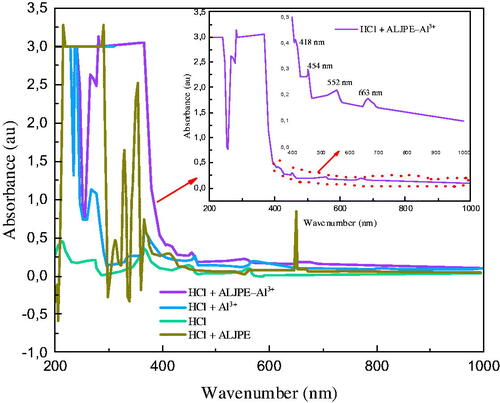
Figure 16. FTIR spectra for uninhibited (Blank–Al3+) and ALJPE-inhibited (ALJPE–Al3+) Al systems and their solutions (a) and the full-scale ALJPE-inhibited (ALJPE–Al3+) Al system (b).
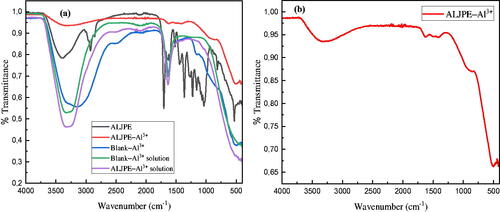
Table 9. FTIR spectral peaks and their identification for ALJPE, Blank–Al3+ corrosion products, and ALJPE–Al3+ adsorption film on Al in 1 M HCl.