Figures & data
Figure 1. Schematic overview of experimental setup with placement of pleural and subcutaneous microdialysis catheters.
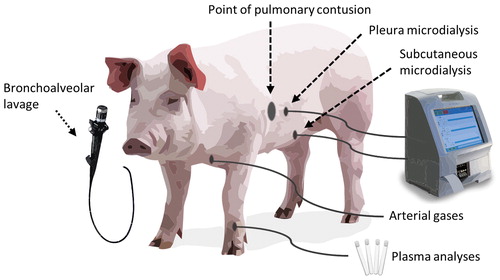
Figure 2. Photos showing (a) placement of catheter in the pleura by loss-of-resistance technique with a syringe filled with NaCl. (b) microdialysis pump. (c) skin with laceration at the point of impact, with a microdialysis (MD) catheter placed at a 50 mm distance. (d) autopsy of lungs showing the contusion with hepatized lung tissue.
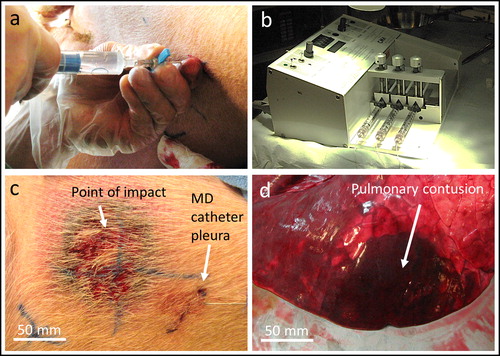
Figure 3. Experimental protocol and temporal overview of sampling.
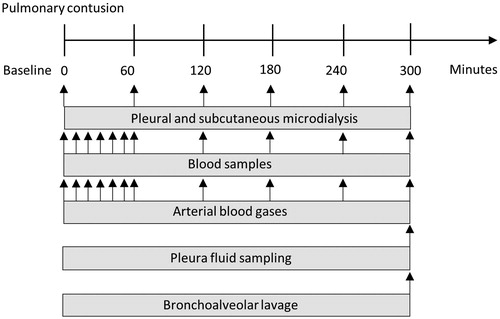
Figure 4. Focally severe pulmonary contusion causes ventilatory complications. (a) pO2 and (b) PaO2/FiO2 decreased after impact, while normo-ventilation was maintained, confirmed by (c) pCO2. As a result, (d) SvO2 decreased. (e) Tidal volumes were below 6 mL/kg, and adequate minute ventilation was achieved by (f) spontaneous regulation of the respiratory rate. *p<.05, ***p<.005.
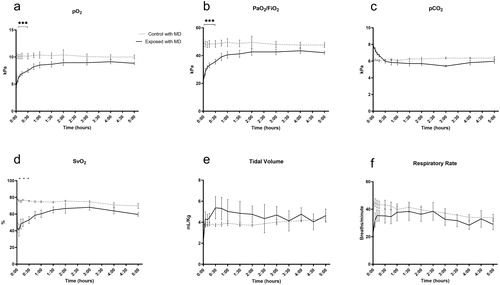
Figure 5. Microdialysis of the pleura and subcutis, and plasma tests. (a-c) pleura lactate increased after trauma in the right pleura, and in plasma. (d-e) pleura and subcutis pyruvate did not differ between groups. (f-g) pleura and subcutis lactate/pyruvate ratio increased after trauma in the right pleura. (h-j) pleura glucose did not differ between groups. Subcutis glucose and plasma glucose increased after trauma. (k-i) pleura and subcutis glycerol increased after trauma in both the ipsilateral and contralateral pleura, although not reaching statistical significance. *p<.05.
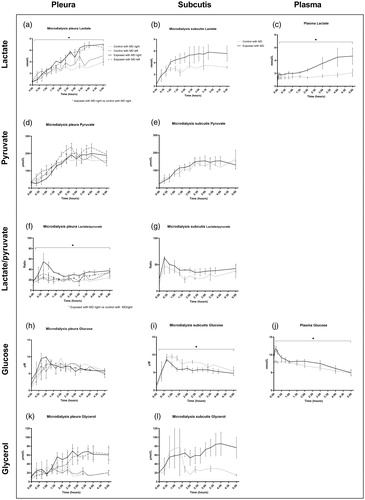
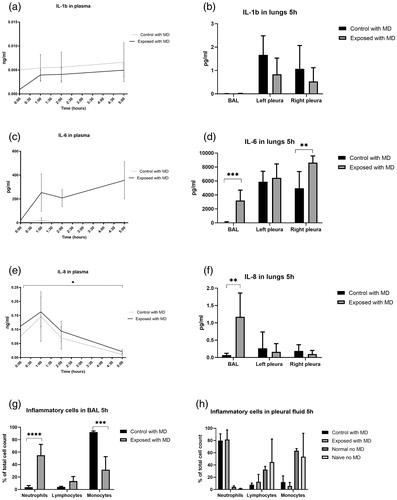
Figure 6. Focally severe pulmonary contusion caused a detectable inflammatory response. IL-1b in (a) plasma and (b) pleura fluid and bronchoalveolar lavage (BAL). IL-6 in (c) plasma and (d) pleura fluid and BAL. IL-8 in (e) plasma and (f) pleura fluid and BAL. (g) inflammatory cells in BAL and (h) pleural fluid after 5 hours. *p<.05, **p<.01, ***p<.005, ****p<.001.