Figures & data
Figure 1. Experimental protocol and temporal overview of sampling. Arrows depict sampling times. MMV = mandatory minute ventilation mode.
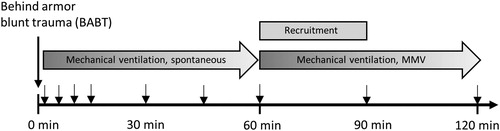
Figure 2. (a) Photo of ceramic armor plate placement. Red dot marks point of projectile impact. (b) Photo of imprint of the skin after BABT (#) and imprint in the ceramic plate (¤). (c) Photo of double lumen tracheal tube with porcine modification (*). (d) Photo of the right lung displaying contusion after BABT (dark area).
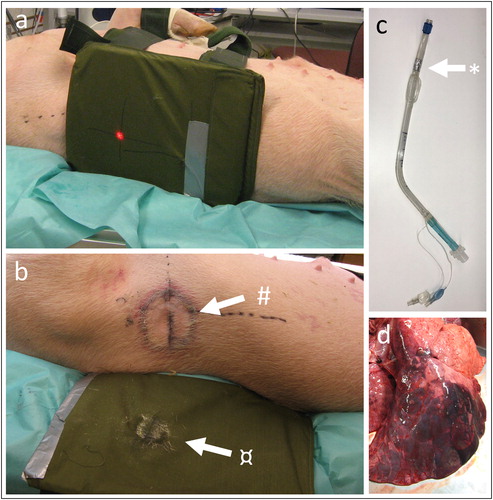
Figure 3. (a–c) BABT causes hypoxia, hypercapnia and a decrease in SvO2. (d–e) PEEP and pressure support were kept constant during the 60 minutes observation phase and increased during the 60 min alveolar recruitment phase. (f) Breathing frequency decreased after BABT during the first 60 minutes. (g) SaO2 decreased after BABT and during alveolar recruitment. (h) MPAP increased because of hypoxic pulmonary vasoconstriction after BABT and during alveolar recruitment. (i) MAP decreased 5 minutes after BABT. R means alveolar recruitment. *p < .05, **p < .01, ****p < .001.
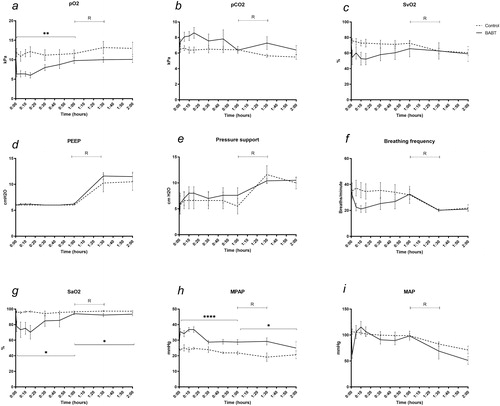
Figure 4. Individual dynamic airway measurements in the lungs. (a–c) Alveolar minute ventilation remained stable between groups. (d–f) Static compliance decreased after BABT in the right lung which was compensated by an increase in the left lung. (g–i) Physiological dead space decreased in the right lung after BABT while the left lung was unchanged, and both lungs combined displayed a net decrease in dead space after BABT. (j–l) V′A/Q′ decreased in the right lung and both lungs combined following BABT while not in the left lung. (m–o) CO2 slope, indicative of V′A/Q′ mismatch, decreased in the right lung following BABT while the left lung and both lungs combined remained unchanged. R means alveolar recruitment. *p < .05, **p < .01, ***p < .005.
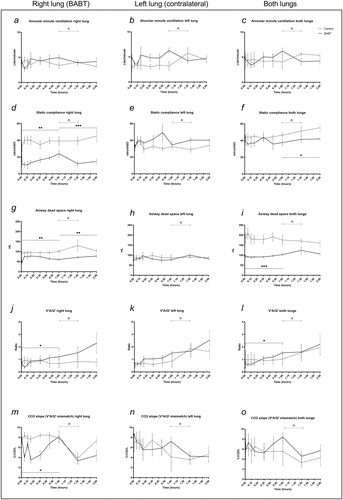
Figure 5. (a) Venous admixture (Qs/Qt) increased from a mean17.3% to 67.7% at 5 minutes after BABT. No difference was detected after alveolar recruitment.(b) CO decreased during the 120 min observation and was not affected by alveolar recruitment, allowing for comparison with venous admixture. (c–d) Qs/Qt correlated with CO with a slope 7.88 and R2 0.11 before recruitment (p < .05). Qs/Qt related to CO with a slope 12.42 and R2 0.29 after recruitment, not showing statistical significance. R means alveolar recruitment. *p < .05.
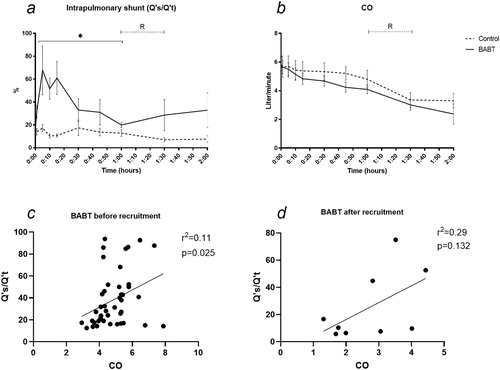
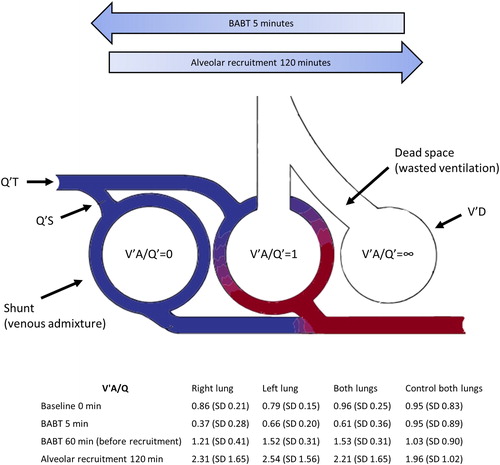
Figure 6. High velocity BABT caused a severe and transient decrease in V′A/Q′ to <1 and shunt formation in the exposed lung. Illustration of three-compartment model proposed by Riley et al.Citation18 and adapted from Petersson and Glenny,Citation10 to quantify VA/Q mismatch as venous admixture and wasted ventilation. Q′T = total pulmonary capillary blood flow, Q′S = total blood flow through shunt, V′D = physiological dead space ventilation.