
Figures & data
Figure 1. Timeline of the animal experiments. Three mice were used in each group in the animal experiments. CT, computed tomography; H&E, hematoxylin and eosin; RT-qPCR, reverse transcription quantitative polymerase chain reaction; MLFs, mouse lung fibroblasts; BALF, bronchoalveolar lavage fluid; ELISA, enzyme-linked immunosorbent assay.
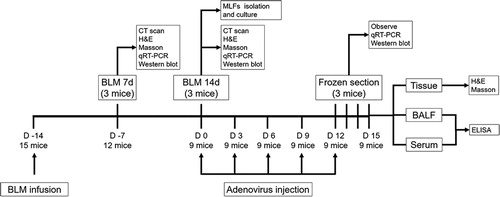
Table 1. Primers.
Table 2. Antibodies in western blot.
Figure 2. Bach1 siRNA adenovirus injection in PF mice. GFP images of the green fluorescence in adenovirus (A), Bach1 mRNA expression (assessed by RT-qPCR) (B), Bach1 protein expression (C) and quantification of Bach1 protein expression (D) in lung tissues after Bach1 siRNA adenovirus transfection from PF mice induced by BLM. Three mice were used in each group in the animal experiments. White arrows indicated the green fluorescence of adenovirus in lung tissue collected from the mice, indicating a successful transfection. Bach1, BTB and CNC homology 1; GFP, green fluorescent protein; RT-qPCR, reverse transcription quantitative polymerase chain reaction.
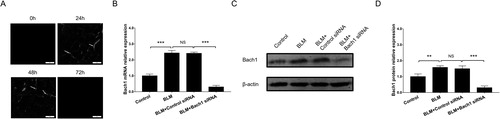
Figure 3. Bach1 siRNA adenovirus reduced fibrosis and inflammation in PF mice. H&E staining and Masson’s trichrome staining of lung tissues (A), blue staining area of Masson’s trichrome staining (B), ELISA assessed COL1A1 expression in serum (C), COL1A1 expression in BALF (D), IL-6 expression in serum (E), and IL-6 expression in BALF (F) from PF mice. Three mice were used in each group in the animal experiments. Bach1, BTB and CNC homology 1; COL1A1, collagen type I alpha 1 chain; IL-6, interleukin-6; H&E, hematoxylin-eosin; BALF, bronchoalveolar lavage fluid; ELISA, enzyme-linked immunosorbent assay.
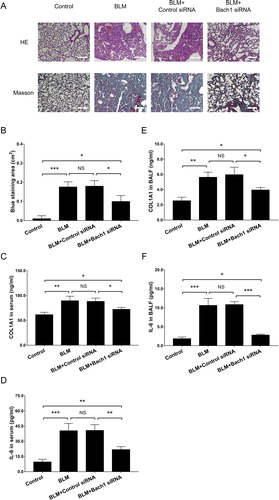
Figure 4. Bach1 siRNA adenovirus blocked ERK pathway in PF cell model. The mRNA expressions (assessed by RT-qPCR) of Smad2 (A), Smad3 (B), Smad4 (C), Smad7 (D), ERK (E), JNK (F) and Akt (G) in PF cell model in Control group, TGF-β1 group, TGF-β1 + Control siRNA group and TGF-β1 + Bach1 siRNA group, their protein expressions (assessed by western blot) as well as phosphorylated protein expressions (H); and gray scale quantification of the protein expressions of p-Smad2/3 (I), Smad4 (J), Smad7 (K), p-ERK (L), p-JNK (M), as well as p-Akt (N) among the four groups. TGF-β1 concentration was 5 ng/ml. The MLFs were collected from each mouse in the BLM group. Replicas in all the cell experiments was 3. Bach1, BTB and CNC homology 1; TGF-β1, transforming growth factor beta 1; ERK, extracellular regulated MAP kinase; MLFs, mouse lung fibroblasts; JNK, c-Jun NH2-terminal kinase; Akt, protein kinase B; RT-qPCR, reverse transcription quantitative polymerase chain reaction.
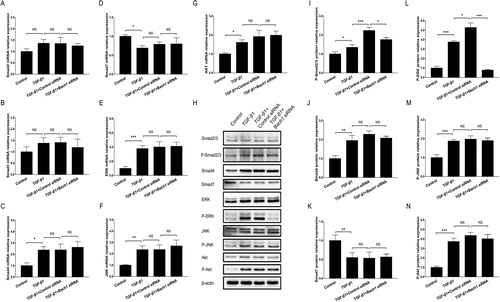
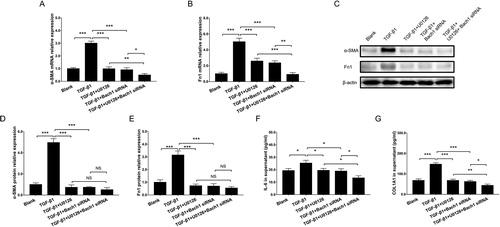
Figure 5. Bach1 siRNA adenovirus reduced cell fibrosis and inflammation in PF cell model. RT-qPCR assessed α-SMA mRNA expression (A), Fn1 mRNA expression (B), western blot assessed α-SMA and Fn1 protein expressions (C), gray scale quantification of α-SMA (D) and Fn1 (E) protein expressions, ELISA assessed COL1A1 expression in supernatant (F) and IL-6 expression in supernatant (G) in PF cell model among the Blank group, TGF-β1 group, TGF-β1 + U0126 group, TGF-β1 + Bach1 siRNA group and TGF-β1 + U0126 + Bach1 siRNA group. TGF-β1 concentration was 5 ng/ml. The MLFs were collected from each mouse in the BLM group. Replicas in all the cell experiments was 3. Bach1, BTB and CNC homology 1; MLFs, mouse lung fibroblasts; α-SMA, alpha-smooth muscle actin; Fn1, fibronectin 1; IL-6, interleukin-6; COL1A1, collagen type I alpha 1 chain; TGF-β1, transforming growth factor beta 1; CCK-8, cell counting kit-8; RT-qPCR, reverse transcription quantitative polymerase chain reaction; ELISA, enzyme-linked immunosorbent assay.
ielu_a_1849448_sm8144.zip
Download Zip (5.1 MB)Availability of data and materials
All data generated or analyzed during this study are included in this article [and its supplementary information files].