
Figures & data
Figure 1. List of experimental groups. The 65 mm/58-gram weight variation group (n = 12) was also divided into different speeds and in subsequently presented as 65 mm speed variation. 7.62 B means BABT with protective backing.
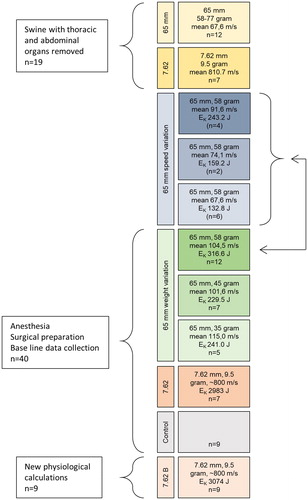
Figure 2. Experimental setup of the live swine. Arrows indicate time of data sampling.
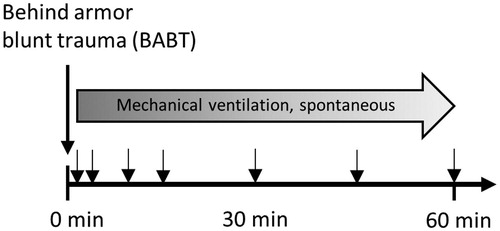
Figure 3. A. photo of the 7.62 mm assault rifle in its experimental rig. B. photo of ceramic armor plate placement. Red dot marks point of projectile impact. C. photo of imprint of the skin after BABT and imprint in the ceramic plate. D. photo of the 65 mm BABT-simulator in its experimental rig. E. high speed camera photo of 65 mm projectile impacting the thoracic wall. F. photo of thoracic wall in swine with removed internal organs, with hole for measuring of the inside chest wall movement. Red dot is the reflection of the laser measurement beam on the inside of the thoracic wall.
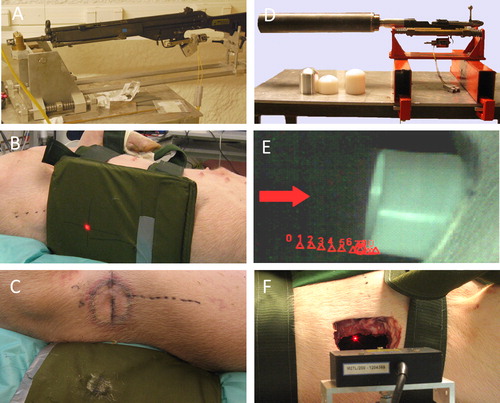
Figure 4. Validation of the 65 mm BABT-simulator to 7.62 BABT. A-B. The back-face signature and max speed of the thoracic wall did not differ between 7.62 mm and the 65 mm BABT-simulator. C. the back-face signature of the BABT-simulator correlated to Ek. D-E. Logistic regression of rib fracture and back-face signature from the BABT-simulator. Rib fractures had a 50% likelihood at back-face signature 22.95 mm, area under ROC curve 0.93. F. Example of retardation of the 65 mm projectile on thoracic impact. Ek was calculated for the velocity just before impact.
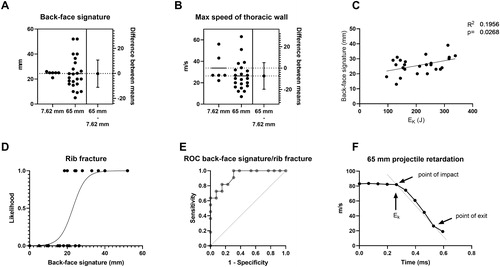
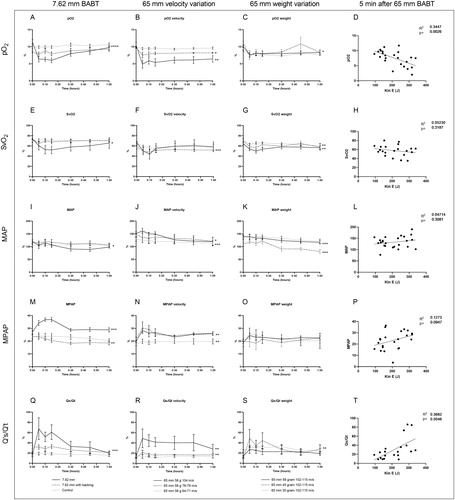
Figure 5. Physiological effects of graded BABT. A-D. pO2 displayed a similar effect profile after high velocity BABT by 7.62 mm assault rifle and BABT-simulator. Differentiating velocity and speed of the 65 mm projectile caused a graded physiological response. E-H. SvO2 displayed a similar effect profile after high velocity BABT by 7.62 mm assault rifle and BABT-simulator. I-L. MAP displayed a similar effect profile after high velocity BABT by 7.62 mm assault rifle and BABT-simulator. M-P. MPAP displayed a similar effect profile after high velocity BABT by 7.62 mm assault rifle and BABT-simulator. Q-T. Q’s/Q’t displayed a similar effect profile after high velocity BABT by 7.62 mm assault rifle and BABT-simulator. *p<.05, **p<.01, ***p<.005.
Supplemental_online_material_BABT_kinE.mp4
Download MP4 Video (837.9 KB)Data availability statement
The data that support the findings of this study are available from the corresponding author, [MG], upon reasonable request.