
Figures & data
Table 1. Characteristics of enrolled infants.
Table 2. Primer sequences for qRT-PCR.
Figure 1. The expression of KLF4/Klf4 and LEF1/Lef1 are diminished in Clinical BPD serum samples and hyperoxia-induced MLE-12 cells. A-B. The levels of KLF4 and LEF1 in serum samples from BPD patients (n = 20) and healthy volunteers (n = 20) were evaluated utilizing qRT-PCR, male: grey, female: black; C. Klf4 and Lef1 expression were measured by qRT-PCR; D. The levels of KLF4 and LEF1 in MLE-12 cells induced by hyperoxia were evaluated utilizing western blot. Data were displayed as mean ± SD (n = 3), and analyzed utilizing t test; **, p < 0.01; ***, p < 0.001.
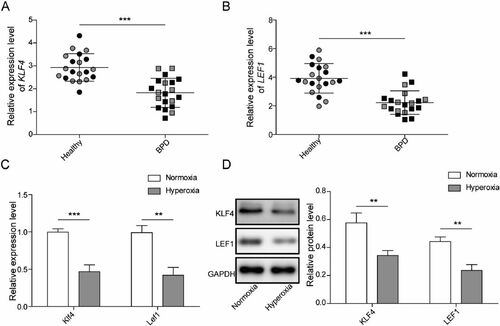
Figure 2. Overexpression of Lef1 suppresses hyperoxia-induced AEC injury. A. The expression of Lef1 was evaluated by qRT-PCR; B. Western blot assay for LEF1 level after transfecting oe-LEF1 into hyperoxia-induced MLE-12 cells; C. The cell viability was determined using CCK-8 assay; D. The cell proliferation was determined using EdU assay; E. Cell apoptosis was investigated by flow cytometry assay; F. The expression of Bcl-2, cleaved-caspase 3 and 9 were determined using western blot. Data were displayed as mean ± SD (n = 3) and analyzed utilizing one-way ANOVA, followed by Tukey’s multiple comparisons test; **, p < 0.01; ***, p < 0.001.
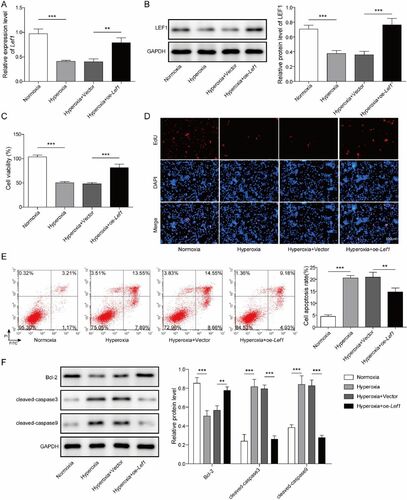
Figure 3. Klf4 activates the transcription of Lef1. A. JASPAR (https://jaspar.genereg.net/) was employed to predict probable Klf4 binding sites in the Lef1 promoter; B. The luciferase and C. ChIP assays were used to validate the prediction from JASPAR. D. Lef1 expression was determined by qRT-PCR; E. Western blot assay for LEF1 level after transfection in normoxia or hyperoxia treated MLE-12 cells with oe-Klf4. Data were displayed as mean ± SD (n = 3) and analyzed utilizing t test or one-way ANOVA followed by Tukey’s multiple comparisons test; ***, p < 0.001.
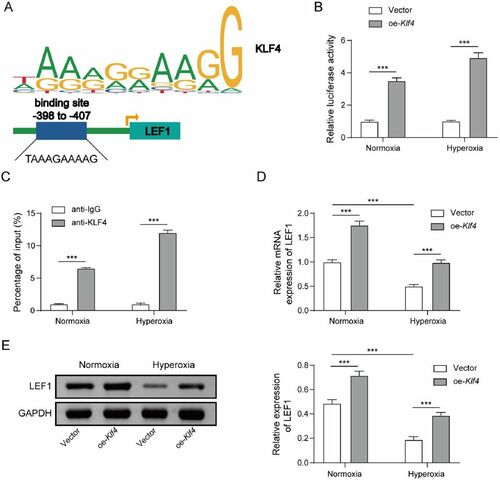
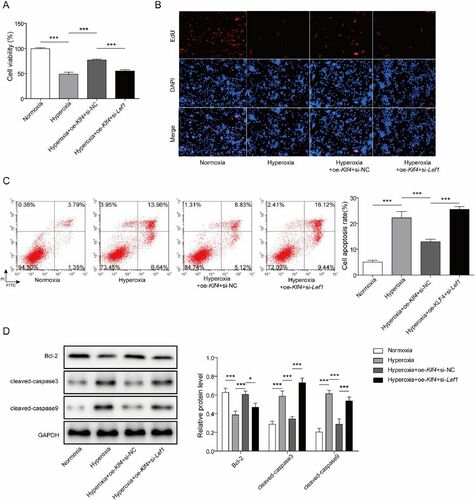
Figure 4. Klf4 impedes hyperoxia-induced alveolar epithelial cell damage via stimulating Lef1. A The cell viability was determined using CCK-8 assay after co-transfecting oe-Klf4 and si-Lef1 into hyperoxia-induced MLE-12 cells; B. The cell proliferation was determined using EdU assay; C. Cell apoptosis was investigated by flow cytometry assay; D. The expression of Bcl-2, cleaved-caspase 3 and 9 were determined using western blot. Data were displayed as mean ± SD (n = 3) and analyzed utilizing one-way ANOVA, followed by Tukey’s multiple comparisons test; *, p < 0.05; ***, p < 0.001.
Data availability statement
The datasets used or analyzed during the current study are available from the corresponding author on reasonable request.