
Figures & data
Figure 1. A schematic illustration of the experimental protocols. The left lung ischemia for 90 min and reperfusion for 4h. STZ, streptozotocin; 3-MA, 3-methyladenine.
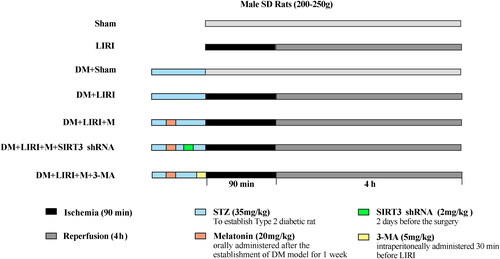
Figure 2. Melatonin regulated mitophagy activity through SIRT3 signaling following diabetic lung ischemia reperfusion injury. (A) The downregulation of levels of SIRT3 were evaluated by western blots (n = 4 in each group). (B) SIRT3 expression. (C) mRNA expression of SIRT3 (n = 4 in each group). (D) Representative blots. (E) SIRT3 expression. (F) Parkin expression. (G) LC3-II expression. (H) p62 expression. LC3-II, microtubule-associated protein 1 light chain 3 beta. (I) PGC-1α expression. (**P < 0.05 versus Con group, *P < 0.05 versus Con + Sham group, ^P < 0.05 versus Con + IR group, #P < 0.05 versus DM + IR group, &P < 0.05 versus DM + IR + M group; n = 8 in each group).
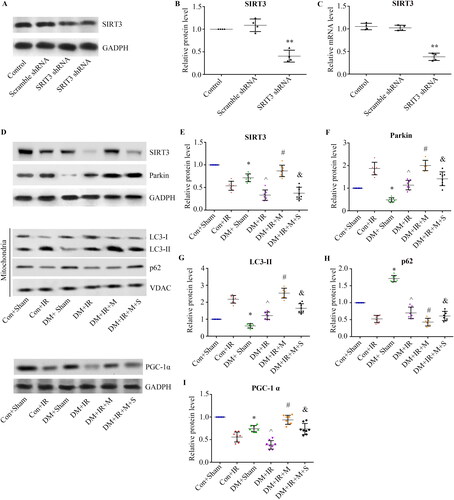
Figure 3. Melatonin improved pulmonary function through SIRT3-dependent mitophagy following diabetic LIRI. (A) Arterial blood gas analysis. T0–T4 represent the following time points: baseline, end of ischemia, 120 and 240 min after reperfusion. (B) Wet/dry weight ratio. (C) Histologic analysis of lung tissues (scale bars, 100 μm). (D) Lung injury score. (E) Protein concentrations in the BALF. BALF, bronchoalveolar lavage fluid; PaO2/FiO2, partial pressure of arterial oxygen (PaO2)/fraction of inspired oxygen (FiO2). (*P < 0.05 versus Con + Sham group, ^P < 0.05 versus Con + IR group, #P < 0.05 versus DM + IR group, &P < 0.05 versus DM + IR + M group; n = 8 in each group).
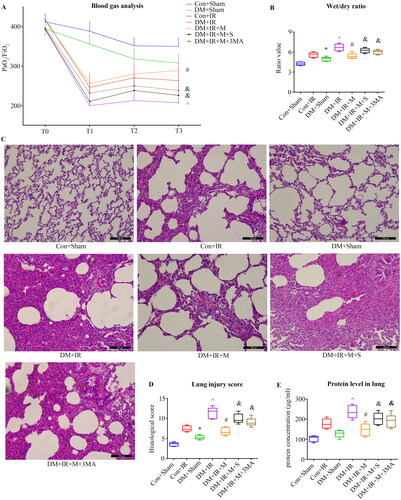
Figure 4. Melatonin alleviated inflammatory, oxidative stress through SIRT3-dependent mitophagy following diabetic LIRI. (A) Serum concentrations of interleukin-1β (IL-1β). (B) Serum concentrations of interleukin-10 (IL-10). (C) Serum concentrations of TNF-α. (D) Lung concentrations of MPO. (E) Lung concentrations of SOD. (E) Lung concentrations of MDA. IL, interleukin; TNF-a, tumor necrosis factor-a; MPO, myeloperoxidase; MDA, malonaldehyde; SOD, superoxide dismutase. (*P < 0.05 versus Con + Sham group, ^P < 0.05 versus Con + IR group, #P < 0.05 versus DM + IR group, &P < 0.05 versus DM + IR + M group; n = 8 in each group).
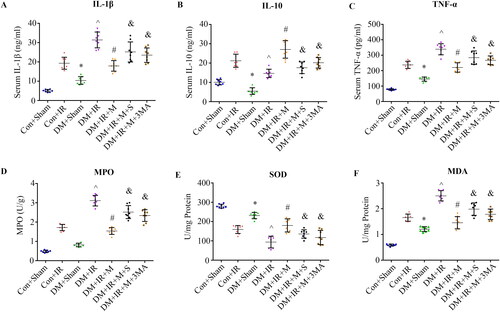
Figure 5. Melatonin attenuated cell apoptosis through SIRT3-dependent mitophagy following diabetic LIRI. (A) Representative in situ detection of lung parenchymal cell apoptosis by TUNEL staining (scale bars, 500 μm). (B) Percentage of TUNEL-positive nuclei. TUNEL, Terminal deoxynucleotidyl transferase dUTP nick end-labeling. (*P < 0.05 versus Con + Sham group, ^P < 0.05 versus Con + IR group, #P < 0.05 versus DM + IR group, &P < 0.05 versus DM + IR + M group; n = 8 in each group).
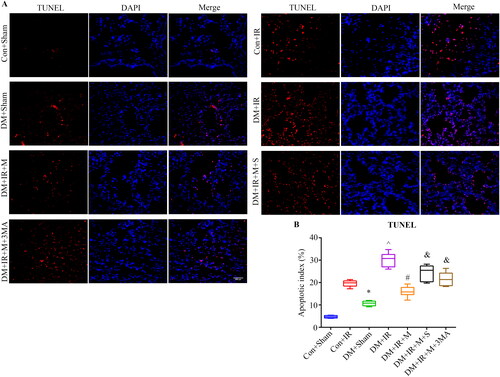
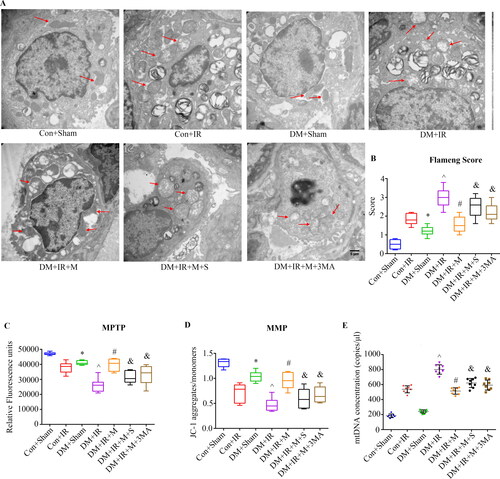
Figure 6. Melatonin limited mitochondrial damage and dysfunction through SIRT3-dependent mitophagy following diabetic LIRI. (A) Mitochondrial ultrastructure. Mitochondria (arrows) in type II alveolar epithelial cells were imaged with transmission electron micrographs (scale bars, 5 μm). (B) Flameng score. (C) Determination of MPTP opening. (D) Determination of mitochondrial membrane potential. (E) BALF mtDNA measurements. MPTP, mitochondrial permeability transition pores; MMP, mitochondrial membrane potential (*P < 0.05 versus Con + Sham group, ^P < 0.05 versus Con + IR group, #P < 0.05 versus DM + IR group, &P < 0.05 versus DM + IR + M group; n = 8 in each group).
Data availability statement
The datasets supporting the conclusions of this article are included within the article.