
Figures & data
Figure 1. Disector method, counting of AEII. The number of AEII per lung was determined light microscopically using the disector principle. Comparing paired sections from the same tissue block with known distance in z direction (sampling section for counting, look-up section for comparison), AEII were counted if their nucleolus was visible in the sampling section but not in the look-up section. The section pairs were used for counting in both directions, i.e. using each section once for counting and once for comparison. The height (h) of the light microscopic disector was 2 µm. Scale bar = 25µm.
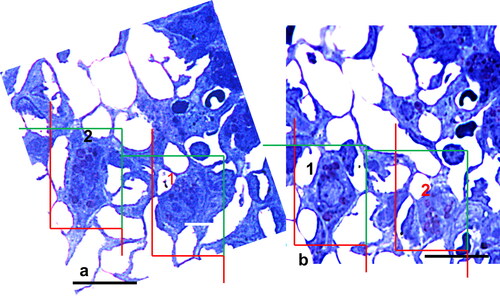
Figure 2. Disector method, counting of Lb. Cellular Lb were counted on paired sections if Lb appeared in one section but not in the other. As for counting of AEII, each section was used once for counting and once for comparison (i.e. counting in both directions). The height (h) of the electron microscopic disector was 100 nm. Scale bar = 2 µm.
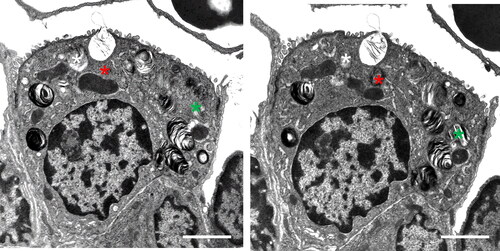
Table 1. Body weight and lung volume.
Table 2. Volume and number of alveolar epithelial cells type II (AEII).
Figure 3. Alveolar space, alveolar lining layer with hypophase. (a) Control lung: surface active subtypes in the hypophase (tubular myelin, tm) covered by the partly seen surface film, visible also partly in asthma induced lungs. Scale bar = 1µm. (b) Controls: surface active subtypes (tm) and surface inactive subtypes (unilamellar vesicles, ulv (asterisk) and multilamellar vesicles, mlv, arrow), visible also partly in asthmatic lungs. Scale bar = 1µm. (c) OVA sensitized and challenged animals: surface active subtypes and surface film (arrows), which are lifted off by intra-alveolar protein rich fluid accumulation (asterisks), visible only in asthma induced lungs. Scale bar = 1µm. (d) OVA sensitized and challenged animals: Extensive accumulation of inactive surfactant components (ulv and mlv, arrows), visible only in asthma induced lungs. Scale bar = 1µm.
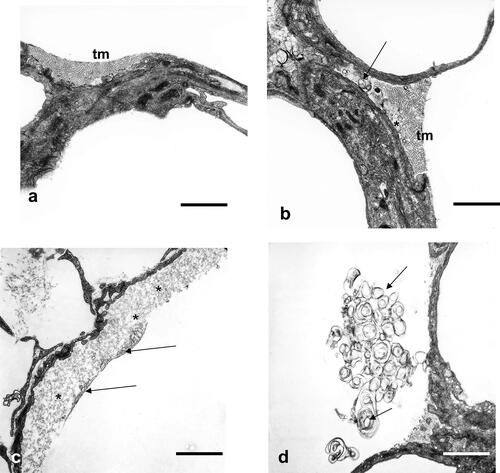
Figure 4. Type II alveolar epithelial cells (AEII). (a) Control lung: AEII, structurally intact, with intact organelles. Lb appear normal in number and size. Scale bar = 2µm. (b) OVA sensitized and challenged lung: structurally intact AEII. Distribution and size of Lb profiles are qualitatively comparable with controls. No giant or very small Lb profiles or unnatural accumulation as signs of disturbances of intracellular surfactant synthesis are seen. Scale bar = 2 µm.
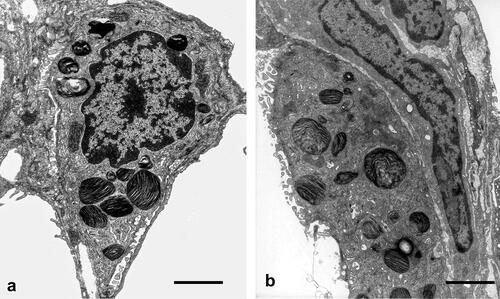
Table 3. Volume densities of subcellular organells of AEII.
Table 4. Characterization of intracellular surfactant.
Table 5. Total number and volume of Lb.