
Figures & data
Table 1. Patient demographics.
Figure 1. CircRNA expression profile in mononuclear cells of COPD and characterization of has-circ-0008833. (A) The number of the differentially expressed circRNAs in 10 pairs of human ACOPD, SCOPD mononuclear cells and matched control. (B) The volcano plot of dysregulated circRNAs in 10 pairs of human ACOPD, SCOPD mononuclear cells and matched control. (C) GO analysis of the differentially expressed circRNA host genes in the SCOPD group and healthy control group. (D) KEGG analysis of the differentially expressed circRNA host genes in the SCOPD group and healthy control group.
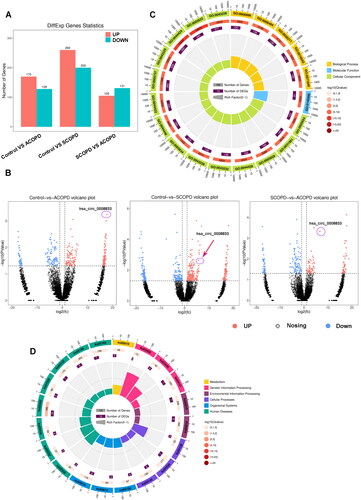
Figure 2. Has-circ-0008833 encodes a small peptide. Flag-labeled vectors were constructed to assess the potential protein-coding capacity of has-circ-0008833. (A) Protein level of flag in 16HBE cells was detected by Western blot. Quantification of flag expression by normalizing to Actin. (B) The expression of has-circ-0008833 in 16HBE cells after LPS treatment was detected by RT-PCR. (C) 16HBE cells proliferation ability was determined by CCK-8 assay. (DE) The death rate of 16HBE cells was evaluated using PI staining detected by Flow cytometry. Results are expressed as means ± SD (n = 3, ***p < 0.001).
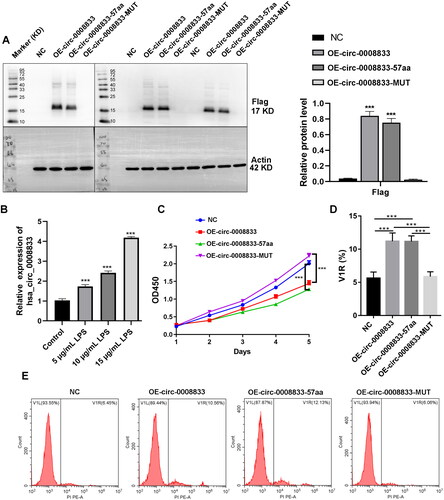
Figure 3. Has-circ-0008833 and its peptide promotes the death of 16HBE cells assessed by immunofluorescence analyses. (A) Immunofluorescence representative images of dead 16HBE cells stained with propidium iodide (PI). (× 400 magnification; blue: DAPI; red: PI; n = 3.).
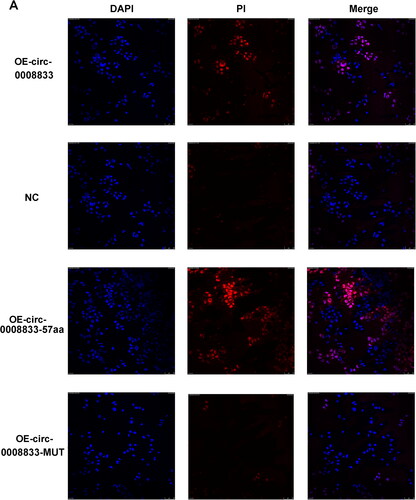
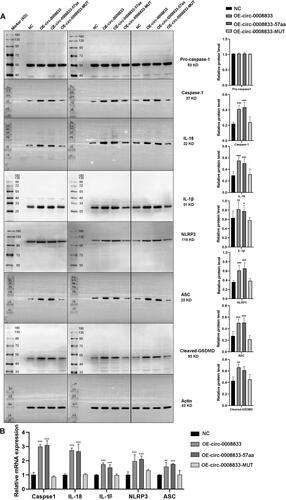
Figure 4. Has-circ-0008833 and its peptide induces pyroptosis in bronchial epithelial cells. (A) The protein level of pro-caspase-1, Caspase-1, IL-1β, IL-18, NLRP3, ASC and cleaved GSDMD in 16HBE cells was measured by Western blot. Quantification of flag expression by normalizing to Actin. (B) The mRNA level of Caspase-1, IL-1β, IL-18, NLRP3 and ASC in 16HBE cells was determined by qPCR. Eight separate western blot experiments using the same amount of protein samples. Results are expressed as means ± SD (n = 3, *p < 0.05, **p < 0.01, ***p < 0.001).
Supplemental Material
Download MS Word (177.5 KB)Availability of data and materials
The datasets used and/or analyzed during the current study are available from the corresponding author on reasonable request.