
Figures & data
Table 1. Primer sequence of qPCR.
Table 2. Antibodies used for Western blotting.
Figure 1. NLRP3 activation and BCL6 expression in lung tissues of hyperoxia and LPS induced BPD mice. (A and B) Expression levels of NLRP3, Caspase-1, IL-1β, IL-18, IL-6, TNF α and MCP-1 mRNA. (C and D) mRNA levels of BCL6 in hyperoxia and LPS induced BPD model, respectively. (E) Representative images of Western blots. (F and G) Expression levels of BCL6 protein in hyperoxia and LPS induced BPD model, respectively. *p < .05 vs. 21% O2; **p < .01 vs. 21% O2; ***p < .001 vs. 21% O2. #p < .05 vs. PBS; ##p < .01 vs. PBS. Values are mean ± SE, n = 4–6 per group.
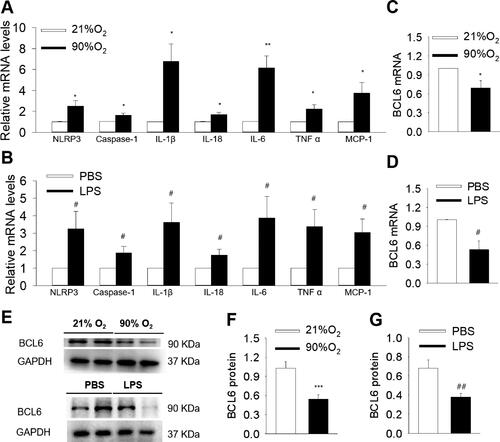
Figure 2. Effects of BCL6 overexpression (OE) on alveoli and pulmonary vessels development in hyperoxia-induced BPD mice aged 2 and 4 wk old, respectively. (A) Representative H&E stained lung sections (magnification, ×400). (B) Quantification of mean linear intercept (MLI). (C) Quantification of alveoli number. (D) Representative Immunohistochemistry images of CD31 (magnification, ×200). (E) Quantification of CD31 immunoreactivity. (F) Representative images of Western blots. (G) The relative protein expression of CD31 in the lung. **p < .01 vs. 21% O2+rAAV9-Vector; ***p < .001 vs. 21% O2+rAAV9-Vector; #p < .05 vs. rAAV9-Vector; ##p < .01 vs. rAAV9-Vector; ###p < .001 vs. rAAV9-Vector. Values are mean ± SE, n = 4–6 per group.
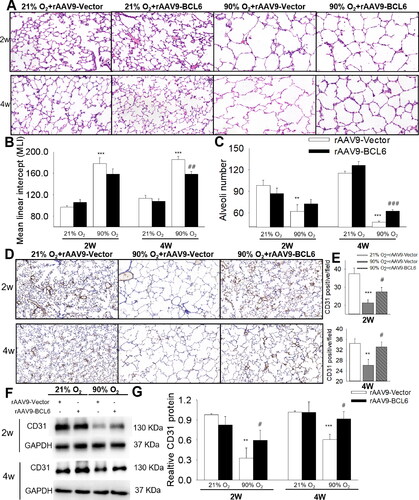
Figure 3. Effects of BCL6 OE on NLRP3-mediated inflammation in hyperoxia-induced BPD mice aged 4 wk old. (A and B) Relative mRNA levels of NLRP3, IL-1β, IL-18, TNF α and IL-6 in the lung. (C and D) the protein expressions of NLRP3, N-GSDMD and Caspase-1 in the lung. (E) total protein concentration in bronchoalveolar lavage fluid (BALF). (F) Total cell count in BALF. *p < .05 vs. 21% O2+rAAV9-Vector; ***p < .001 vs. 21% O2+rAAV9-Vector; #p < .05 vs. rAAV9-Vector; ##p < .01 vs. rAAV9-Vector; ###p < .001 vs. rAAV9-Vector. Values are mean ± SE, n = 4–6 per group.
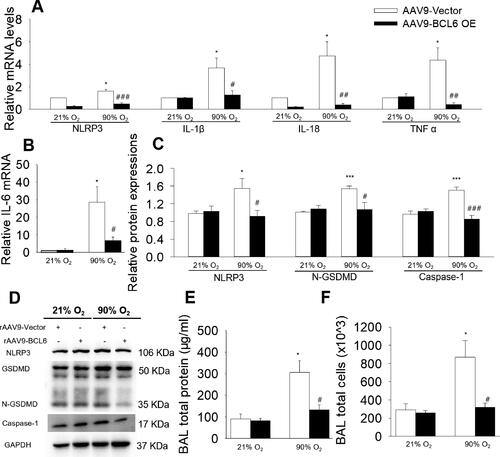
Figure 4. Effects of BCL6 OE on cell proliferation, apoptosis, angiogenesis and NLRP3-mediated inflammation in hyperoxia-induced HPMECs. (A) Representative images of EdU incorporation assay. Blue fluorescence shows cell nuclei and green fluorescence stands for cells with DNA synthesis. (B) The protein expression of PCNA. (C) Apoptosis of HPMECs via flow cytometry. (D) Tube formation of HPMECs. (E) Representative images of Western blots. (F) The protein expressions of NLRP3, N-GSDMD and Caspase-1. *p < .05 vs. 21% O2; **p < .01 vs. 21% O2; #p < .05 vs. pcDNA3.1; ##p < .01 vs. pcDNA3.1. Values are mean ± SE, n = 4 per group.
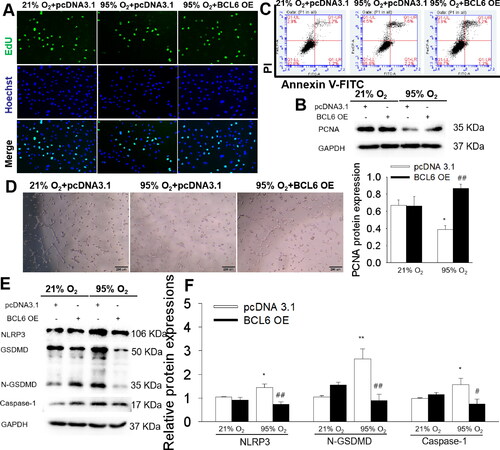
Figure 5. Effect of FX1 on the lung in mice with BPD aged 4 wk. (A) Representative H&E stained lung sections (magnification, ×100). (B) Quantification of MLI. (C) Representative CD31 immunofluorescence staining. (D) Representative images of Western blots. (E) The protein expressions of VEGFA and VEGFR2. (F) The quantitative analysis of Evans blue dye leakage in lung tissues. (G–I) The relative mRNA levels of pro-inflammatory cytokines. (J–L) The relative mRNA levels of anti-inflammatory cytokines. (M) The mRNA levels of matrix metalloproteinases, including MMP-2, MMP-9, fibronectin and TGF-β. (N) Representative Masson’s staining of lung sections. (O) Representative Sirius red staining of lung sections. #p < .05 vs. 21% O2; ##p < .01 vs. 21% O2; ###p < .001 vs. 21% O2; *p < .05 vs. 75% O2; **p < .01 vs. 75% O2; ***p < .001 vs. 75% O2. Values are mean ± SE, n = 6–8 per group.
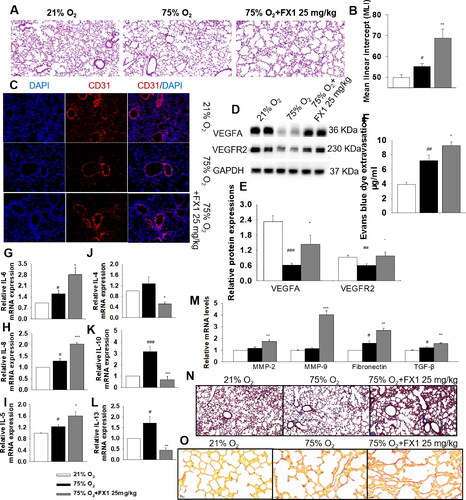
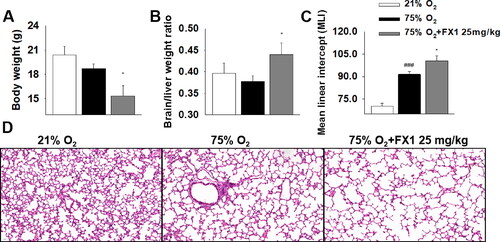
Figure 6. The effects of FX1 on mice aged 7 wk. (A) Effect of FX1 on body weight. (B) Effect of FX1 on brain/liver weight ratio. (C) Quantification of mean linear intercept (MLI). (D) Representative H&E stained lung sections (magnification, ×200). #p < .05 vs. 21% O2; ##p < .01 vs. 21% O2; ###p < .001 vs. 21% O2; *p < .05 vs. 75% O2; **p < .01 vs. 75% O2. Values are mean ± SE, n = 6–8 per group.
Supplemental Material
Download MS Word (1.5 MB)Data availability statement
All data generated or analyzed during this study are available from the corresponding author upon reasonable request.