Figures & data
Figure 1. Effect of LXRs on inflammatory cells. Total cell counts were determined at 400× magnification using a microscope. Data are presented as means for n = 5 in each group. * p < 0.05 CS + LPS Group vs. Control Group; # p < 0.05 GW3965 Group vs. CS + LPS Group; +p < 0.05 LXRα−/−/β−/− Group vs. CS + LPS Group. Three independent experiments were conducted (5 mice in each group for each experiment). LXR, liver X receptor; BALF, bronchoalveolar lavage fluid.
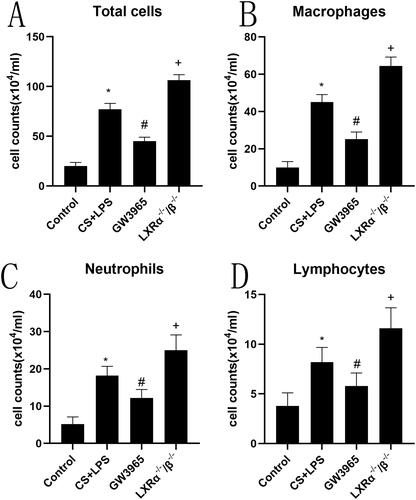
Figure 2. Effect of LXRs on inflammatory cytokines. Levels of IL-6, IL-8, and TNFα in BALF (a, b and c) and serum (d, e and f) were determined by ELISA. Data are expressed as means for n = 5 in each group. * p < 0.05 CS + LPS Group vs. Control Group; # p < 0.05 GW3965 Group vs. CS + LPS Group; +p < 0.05 LXRα−/−/β−/− Group vs. CS + LPS Group. Three independent experiments were conducted (5 mice in each group for each experiment). LXR, liver X receptor; BALF, bronchoalveolar lavage fluid.
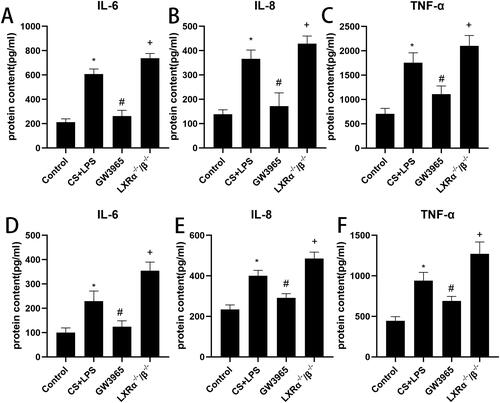
Figure 3. Effect of LXRs on lung lipid homeostasis. (a) The representative oil red O staining of lung tissues (original magnification, ×200); (b): the representative oil red O staining of macrophages in BALF (original magnification, ×200); (c): Differential BALF macrophage cell count describing regular macrophages and foamy macrophages. 1 and 5:Control Group; 2 and 6: CS + LPS Group;3 and 7:GW3965 Group; 4 and 8:LXRα−/−/β−/− Group. Data are presented as means for n = 5 in each group. * p < 0.05 CS + LPS Group vs. Control Group; # p < 0.05 GW3965 Group vs. CS + LPS Group; +p < 0.05 LXRα−/−/β−/− Group vs. CS + LPS Group. Three independent experiments were conducted (5 mice in each group for each experiment). LXR, liver X receptor; BALF, bronchoalveolar lavage fluid.
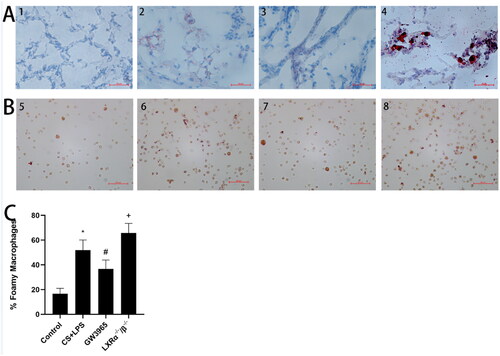
Figure 4. Effect of LXRs on airway remodeling. (a) The representative masson staining of lung tissues (original magnification, ×200). (b) The representative immunohistochemical staining (original magnification, ×200). (c) The representative H&E solution of lung tissues (original magnification, ×200). (d) Representative figures in lung tissues stained with the H&E solution (original magnification, ×200). (e) Image analysis assessing extend of masson’s trichrome staining expressed as means. (f) The area of α-SMA per micrometer length of basement membrane of bronchiole was calculated. (g) Quantitative analysis of the lung destruction, as represented by mean linear intercept. (h) Lung inflammatory scores. Data are expressed as means for n = 5in each group. 1,5,9,13:Control Group; 2,6,10,14: CS + LPS Group; 3,7,11,15:GW3965 Group; 4,8,12,16:LXRα−/−/β−/− Group. Data are presented as means for n = 5 in each group. * p < 0.05 CS + LPS Group vs. Control Group; # p < 0.05 GW3965 Group vs. CS + LPS Group; +p < 0.05 LXRα−/−/β−/− Group vs. CS + LPS Group. Three independent experiments were conducted (5 mice in each group for each experiment). LXR, liver X receptor.
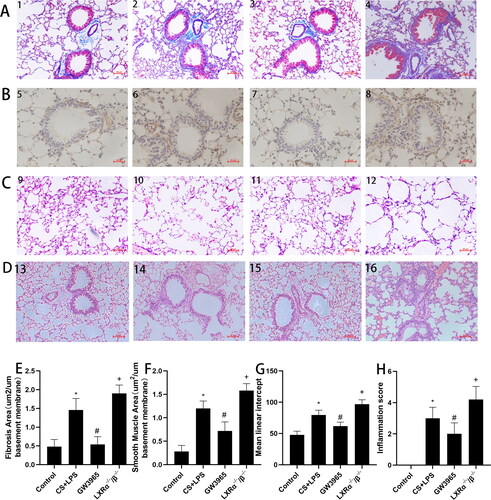
Figure 5. Effect of LXRs on cholesterol efflux-related protein expression. (a) Representative figure of protein expression; (b–e) quantitative analysis of protein expression. Data are presented as means for n = 5 in each group. * p < 0.05 CS + LPS Group vs. Control Group; # p < 0.05 GW3965 Group vs. CS + LPS Group; +p < 0.05 LXRα−/−/β−/− Group vs. CS + LPS Group. Three independent experiments were conducted (5 mice in each group for each experiment). LXR, liver X receptor.
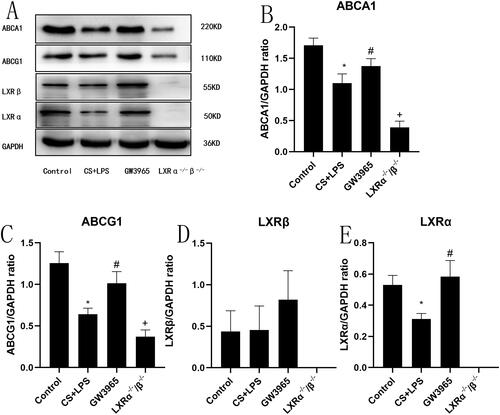
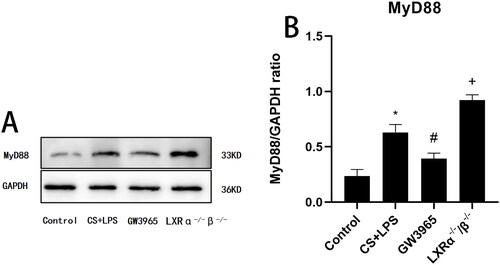
Figure 6. Effect of LXRs on MyD88 expression. (a) Representative figure of protein expression; (b) quantitative analysis of protein expression. Data are presented as means for n = 5 in each group. * p < 0.05 CS + LPS Group vs. Control Group; # p < 0.05 GW3965 Group vs. CS + LPS Group; +p < 0.05 LXRα−/−/β-/- Group vs. CS + LPS Group. Three independent experiments were conducted (5 mice in each group for each experiment). LXR, liver X receptor.