
Figures & data
Figure 1. Experimental design. The schematic presents the procedural protocol, with ‘X’ denoting a micro-computed tomography (µCT) scan and a resection.
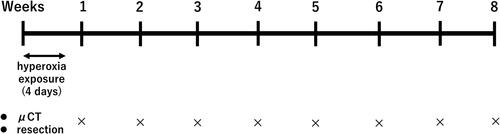
Figure 2. Body weight of mice after neonatal hyperoxic exposure. Bar: Mean value. n = 5 mice per group.
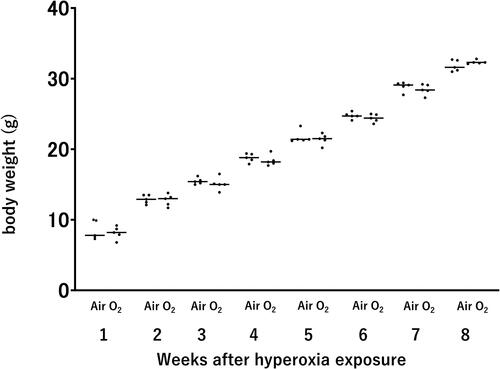
Figure 3. Alveolar development after neonatal hyperoxic exposure.
(a) Hematoxylin and eosin (H&E) staining of histological sections obtained from mice. Scale bar: 50 µm. (b) Mean linear intercept (Lm). Data are presented as the mean ± standard deviation. (c) Alveolar area. Data are presented as the mean ± standard deviation. (d) Alveolar number. Bar: Mean value. n = 5 mice per group. *p < 0.05 vs. Air.
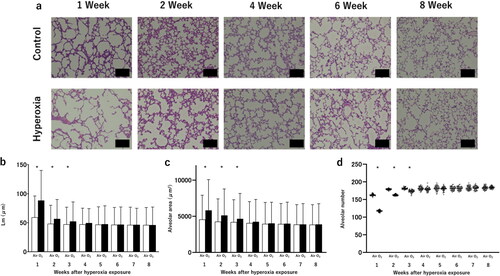
Figure 4. Changes in the secondary septa after neonatal hyperoxic exposure.
(a) Representative elastin-stained histological sections, highlighting secondary septa. Scale bar: 25 µm. (b) Number of secondary septa, representing alveolar septation. Bar: Mean value. n = 5 mice per group. *p < 0.05 vs. Air.
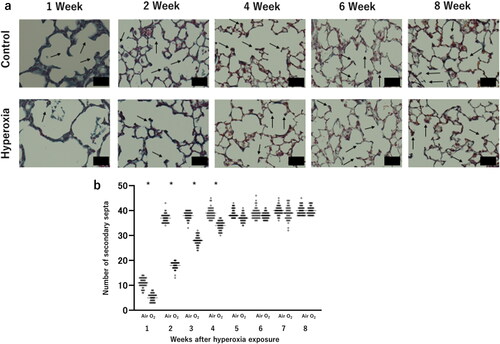
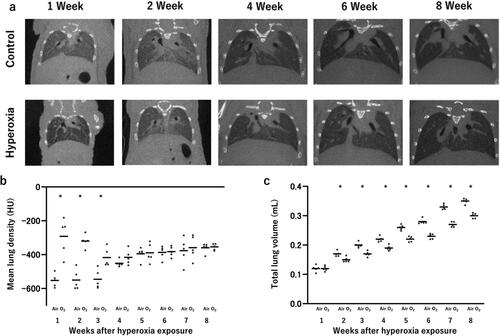
Figure 5. Micro-computed tomography (µCT) for the detection and quantification of the initiation and evolution of response to hyperoxia.
(a) Illustrative images depicting a control mouse and a hyperoxia-exposed mouse at various time points, ranging from 1 to 8 weeks of age. (b) Mean lung density, expressed in Hounsfield unit (HU). Bar: Mean value. (c) Total lung volume, measured in mL. Bar: Mean value. n = 5 mice per group. *p < 0.05 vs. Air.
Data availability statement
All data generated or analyzed during this study are included in this article. Inquiries can be directed to the corresponding author.