
Figures & data
Table 1. Soil properties of pre-plant bulk samples from the experimental site during the 2015 and 2016 growing season for research conducted at the Aberdeen Research and Extension Center, Aberdeen, ID, USA.
Figure 1. Relationship between phosphorus (P) application rate, Olsen P and grain yield at harvest for malt barley during the 2015 and 2016 growing seasons for research conducted at the Aberdeen Research and Extension Center, Aberdeen, ID, USA. Small letters indicate significant differences between pre-plant and post-harvest Olsen P at various P rates as compared using Tukey’s protected honest significant difference (HSD) test at p < 0.05. Capital letters indicate significant differences among grain yield at various P rates as compared using Tukey’s protected honest significant difference (HSD) test at p < 0.05.
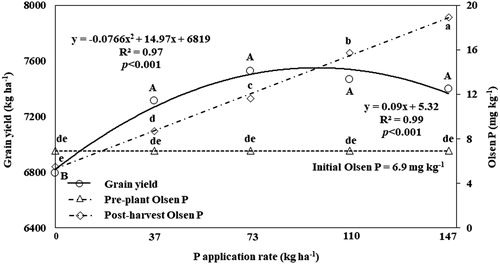
Table 2. Analysis of variance (ANOVA) values for grain yield and yield attributes, grain quality, vegetative and spike P content of malt barley averaged over the 2015 and 2016 growing seasons for research conducted at the Aberdeen Research and Extension Center, Aberdeen, ID, USA.
Table 3. Effects of cultivars and phosphorus (P) application rate on biological yield, harvest index (HI), and grain quality of malt barley during the 2015 and 2016 growing seasons for research conducted at the Aberdeen Research and Extension Center, Aberdeen, ID, USA.
Figure 2. Distribution of phosphorus (P) in vegetative tissues (stems plus leaves) and spike for cultivars and P application rates during the 2015 and 2016 growing seasons for research conducted at the Aberdeen Research and Extension Center, Aberdeen, ID, USA. Different letters between both cultivars indicate significant differences between two cultivars as compared using Fisher’s protected least significant difference (LSD) test at p < 0.05. Different letters among P-application rate indicate significant differences as compared using Tukey’s protected honest significant difference (HSD) test at p < 0.05.
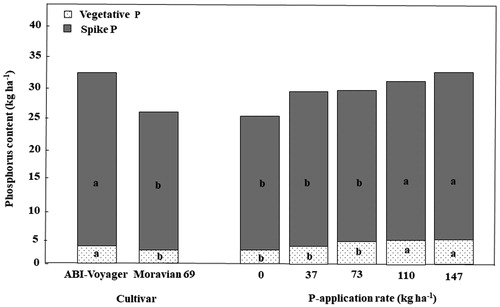
Table 4. Analysis of variance (ANOVA) values for soil parameters averaged over the 2015 and 2016 growing seasons for research conducted at the Aberdeen Research and Extension Center, Aberdeen, ID, USA.