
Figures & data
Table 1. Main characteristics of HD patients analyzed in experimental group.
Figure 1. Ultrastructural alterations in fibroblasts of HD patients in comparison to controls. Pathological changes in ultrastructure of mitochondria and Golgi complex in fibroblasts of patients with HD visualized by transmission electron microscopy (TEM). Pictures were taken on a transmission electron microscope JEOL JEM-1200 EX. a) Normal mitochondria in adult control fibroblasts, b) Cristae disruption (P7), c) Low cristae number, marked by # (P3), d) Mitochondrial swelling, marked by * (P8), e) Degradation bodies, marked by < (P2), f) Structural abnormalities of Golgi complex (P2). Original magnification: 15 000 x (A-E), 25 000 x (f).
Table 2. Semi-quantitative analysis of ultrastructural alterations in fibroblasts of 10 HD patients. Columns present most common disturbances detected in patient’s fibroblasts. The number of crosses (+) defines the level of impairment in category, (-) the phenotype was not detected in the sample. Data were obtained in approximately 100 cells on one grid, where a compact unit with nucleus was considered as a cell.
Figure 2. Mitochondrial network visualization and quantitative analysis of mitochondrial density (MD) and branching factor (BF) in fibroblasts of 7 HD patients (P1 – P7) and 4 controls. a) Native dying of mitochondrial network in fibroblasts of HD patients P1-P7 and 4 controls: Cultivated skin fibroblasts were visualized in 10 nM MTR (MitoTracker RED, Molecular probes, Eugene, OR) 15 min at 37°C. Unequal distribution of mitochondrial network and mild fragmentation were detected in all 7 patients in comparison to controls, although the level of disruption was different in different lines. Original magnification: 600x. b) Mitochondrial density (MD) and Branching factor (BF) analysis in mitochondrial network in fibroblasts of 7 HD patients (P1 – P7) and 4 controls. quantitative analysis was provided in Fiji program. T-test was used for statistical analysis. MD and BF were significantly decreased in patient´s cells compared to controls (p = 0.0051) (p = 0.014),respectively.b)
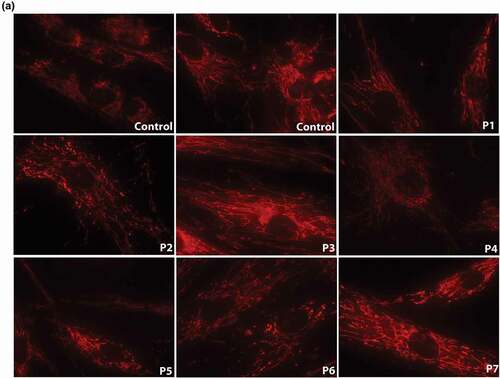
Figure 2. (Continued).
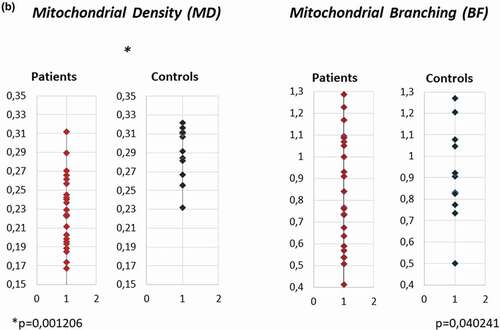
Table 3. Quantification of selected mitochondrial proteins expression in fibroblasts of HD patients and controls. SDS PAGE/WB signal (see Supplementary figure 1) in whole-cell lysates was quantified in G:Box (SynGene imaging system, SynGene UK). Values are in percentage, the average of signal of two adult controls is expressed as 100% of control value. Patient’s values ≤ 80% of controls are red, 120% ≥ in green. Results were normalized to total protein loading and α-tubulin protein. nd – not analyzed.
Figure 3. Alteration of mitochondrial functional parameters in fibroblasts from HD patients. a) Measurement of oxygen consumption. The ratios of average values of oxygen consumption in fibroblasts showed lower values in most of tested patient´s lines in comparison to controls Mitochondrial energy generating system capacity, oxidation of substrate in reaction containing [U-14C]malate+acetylcarnitine+malonate+ADP (b) and [1–414C]succinate+acetylcarnitine+ADP (c) were decreased in HD cells; d) The activity of succinate – coenzyme Q reductase (SQR, complex II of respiratory chain) measured by spectrophotometry, showed a significant interaction of sex, HD and age (p = 0.0078), comparison related to HD and sex are shown. F- female, M- male. Ee) The activity of succinate – coenzyme Q reductase (SQR, complex II of respiratory chain) normalized to activity of citrate synthase (SQR/CS) was associated with sex (p = 0.0213) having a significant interaction of sex, HD and age (p = 0.0188). Comparison related to HD and sex are shown. Details of the effect of age are given in supplement, see Figure S4 and S5.
![Figure 3. Alteration of mitochondrial functional parameters in fibroblasts from HD patients. a) Measurement of oxygen consumption. The ratios of average values of oxygen consumption in fibroblasts showed lower values in most of tested patient´s lines in comparison to controls Mitochondrial energy generating system capacity, oxidation of substrate in reaction containing [U-14C]malate+acetylcarnitine+malonate+ADP (b) and [1–414C]succinate+acetylcarnitine+ADP (c) were decreased in HD cells; d) The activity of succinate – coenzyme Q reductase (SQR, complex II of respiratory chain) measured by spectrophotometry, showed a significant interaction of sex, HD and age (p = 0.0078), comparison related to HD and sex are shown. F- female, M- male. Ee) The activity of succinate – coenzyme Q reductase (SQR, complex II of respiratory chain) normalized to activity of citrate synthase (SQR/CS) was associated with sex (p = 0.0213) having a significant interaction of sex, HD and age (p = 0.0188). Comparison related to HD and sex are shown. Details of the effect of age are given in supplement, see Figure S4 and S5.](/cms/asset/828af83e-66e1-4792-a176-9aad3bf5cf99/iusp_a_2100951_f0003_b.gif)