Figures & data
Figure 1. Location of the field study site in Ghana as a whole, relative to vegetation types (left), and location of vegetation plots relative to one another (right) (Source of map/satellite image).
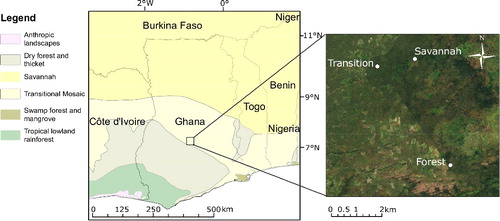
Figure 2. Photographs of the vegetation in the three plots; (a) Forest (KOG02) 7°15'41.9''N, 1°09'00.2''W, 197 m asl; (b) Transition (KOG04) 7°18'07.7'' N, 1°10'50.2''W and 190 m asl; and (c) Savannah (KOG05) 7°18'04.1'' N, 1°09'53.8''W and 186 m asl.
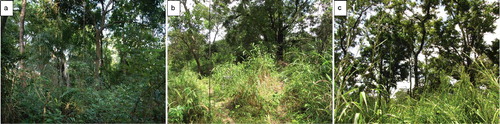
Figure 3. Bar chart showing the vegetation types, as outlined by White (Citation1983), to which the species in the three plots belong.
Figure 4. Diagram showing layout of pollen traps (represented by triangle symbols) within vegetation survey plots. Circled traps indicate those processed and counted, which was every other trap in the Savannah and Transition plots (odd numbers). Asterisk indicates Trap 76 in the Forest plot, which was sampled instead of Trap 75, due to poor condition of Trap 75.
Figure 5. Pollen diagram showing pollen assemblages from each plot, along with total influx values for each trap. Forest traps begin ‘FT’, Transition traps ‘TT’ and Savannah traps ‘ST’.
Table 1. Taxa that occur in both pollen assemblages and vegetation survey for the Forest plot, their abundances in the data set and their R-rel values (average pollen abundance in samples/% basal area of plot covered by vegetation taxon).
Figure 6. Bar chart showing R-rel values of taxa represented in both pollen and vegetation, where p = average % abundance of a taxon and v = total basal area of taxon in the vegetation. Asterisks indicate that the R-rel values were too high to show on the figure; Forest Melastomataceae/Combretaceae R-rel = 6.37 and Erythrophleum suaveolens R-rel = 3.64. Transition Melastomataceae/Combretaceae R-rel = 5.18, and Savannah Melastomataceae/Combretaceae R-rel = 3.53.
Figure 7. Scatter plot of vegetation basal area % against pollen abundance %. Taxon names are as in the text, except Melastomataceae/Combretaceae, which is abbreviated to ‘MelCom’. The R-rel = 1 line is added to illustrate those taxa that are over-represented in the pollen compared to the vegetation (above the line), against those which are under-represented (below the line).
Figure 8. Diversity of the pollen assemblages (box and whisker plots) and the vegetation diversity of the plots (star symbols). Boxes show 25th and 75th percentiles of data; bars near the middle of the boxes show the median value; and ends of whiskers show the extremes of the data, as long as those are not more than 1.5 inter-quartile ranges from the 25th and 75th percentiles. For ‘Forest’ the diversity data are not very variable, leading to its whiskers being short, and its outlying values not being joined by a whisker.
Table 2. Taxa that occur in both pollen assemblages and vegetation survey for the Transition plot, their abundances in the data set and their R-rel values (average pollen abundance in samples/% basal area of plot covered by vegetation taxon).
Table 3. Taxa that occur in both pollen assemblages and vegetation survey for the Savannah plot, their abundances in the data set and their R-rel values (average pollen abundance in samples/% basal area of plot covered by vegetation taxon).
Figure 9. Non-metric multidimensional scaling (NMDS) plot of pollen trap assemblages. Forest traps begin ‘FT’, Transition traps ‘TT’ and Savannah Traps ‘ST’. Polygons encompass all traps of each plot. Named taxa are included in grey. Unidentified pollen taxa were used in the analysis but are not shown in the figure.
Plate 1. Characteristic taxa from all plots. 1 = Erythrophleum suaveolens, 2 = Manilkara obovata, 3 = Alchornea, 4 = Melastomataceae/Combretaceae, 5 = Terminalia sp., 6 = Poaceae sp. Letters ‘a’ and ‘b’ denote polar and equatorial views of the same grain.