Figures & data
Figure 1. Map of the Middle Atlas and forest cover: dark green is predominately needleleaf evergreen, and light green is mixed broadleaf evergreen and needleleaf evergreen. Sample areas are shown in red and towns in black. Map created using Global Multi-resolution Terrain Elevation Data 2010 (GMTED2010) and forestry data extracted from Global Land Cover Characterization (GLCC) imagery. Data available from US Geological Survey (Citation2017).
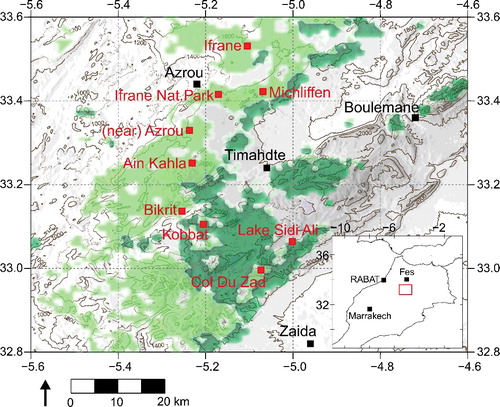
Table 1. Details of the sampling areas where pollen was collected.
Figure 2. Schematic diagram of Cedrus atlantica pollen as it appears under light microscopy (LM), and the different measurements taken under LM.
Figure 3. Results from laser diffraction granulometry. Size data for each sample is presented as the particle size distribution of the sample.
Table 2. Grain size of each measured property (please refer to ) under light microscopy (LM; eight samples, 240 grains measured).
Table 3. Percentage change (%) in size for different properties (please refer to ) of the grain measured under light microscopy (LM) following chemical treatment with KOH.
Table 4. Correlation analysis between the laser diffraction granulometry D50 grain size value, and light microscopy (LM) measurements.
Figure 4. Results of laser diffraction granulometry showing: (A) Dot plot of D50 values for each sample by geographical sampling area, and (B) mean D50 values for each area. Error bars show standard deviation, and dashed horizontal line represents the mean grain size of all samples.
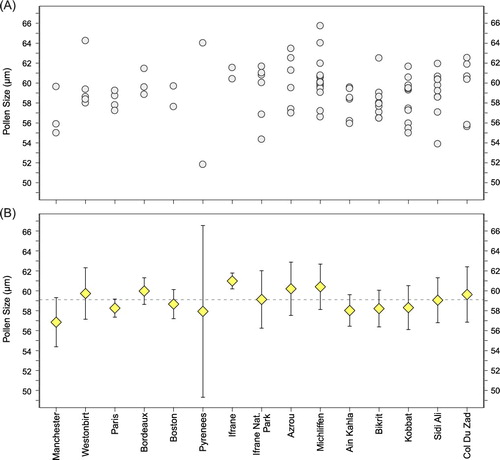
Table 5. Results of regression analysis on pollen grain size. Analysis was tested using individual sample grain size values, and the average grain size for each geographical sampling area.
Figure 5. Biplots showing: (A) carbon isotope discrimination (Δ13C) (Bell et al. Citation2017) versus aridity (self-calibrating Palmer Drought Severity Index, scPDSI) (Dai Citation2011), and (B) pollen grain size versus aridity (scPDSI), with values averaged by each sampling area.
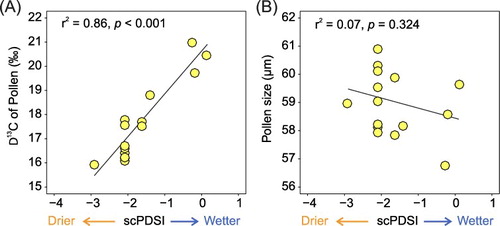
Plate 1. Photographs taken under light microscopy (LM) of Cedrus atlantica pollen grains. Scale indicated on each image. Figures 1–3. Equatorial view showing complete grain. Figures 4–5. Polar view of complete grain. Figures 7–8. Close-up of corpus surface. Figure 9. Corpus surface pattern (extracted using CorelDraw X8). Figures 10–11. Close-up of saccus surface. Figure 12. Saccus surface pattern.
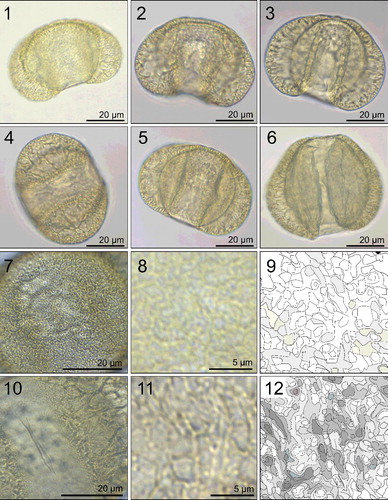
Plate 2. Photographs taken under light microscopy (LM) of treated Cedrus atlantica pollen grains stained with Safranin. Scale indicated on each image. Figures 1–2. Equatorial view showing complete grain at different foci. Figures 3–4. Polar view of complete grain. Figure 5. Close-up of corpus surface. Figure 6. Close-up of saccus surface.

Plate 3. Scanning electron microscopy (SEM) images of Cedrus atlantica pollen grains. Scale indicated on each image. Figure 1. Polar view from the top. Figure 2. Close-up of corpus surface. Figure 3. Equatorial view. Figure 4. Close-up of saccus surface. Figure 5. Polar view from underneath the grain showing the leptoma. Figure 6. Close-up of leptoma, pollen wall visible to the left.
Plate 4. Scanning electron microscopy (SEM) images of treated Cedrus atlantica pollen grains. Scale indicated on each image. Figures 1–2. Polar view from the top and side. Figures 3–4. Equatorial view. Figure 5. Close-up of corpus surface. Figure 6. Close-up of leptoma.