
Figures & data
Figure 1. Map of Australia, Tasmania (TAS), and Maria Island (yellow star) (a) with depiction of regional currents and fronts including the East Australian Current (EAC), its southern extension and spiralling eddies, Tasman Front divergence (TF), Subtropical Front (STF), Subantarctic Front (SAF), Antarctic Circumpolar Current (ACC), Leeuwin Current (LC), and Bass Strait (BS). Enlarged depiction of Maria Island (b) with Mercury Passage (MP) to the west, which separates it from the Tasmanian mainland, and the Tasman Sea (TS) to the east. The location of the inshore (orange triangle) and offshore core sites (red cross) including bathymetry and associated water depth (m) are also shown. Modified from Pardo et al. (Citation2019).
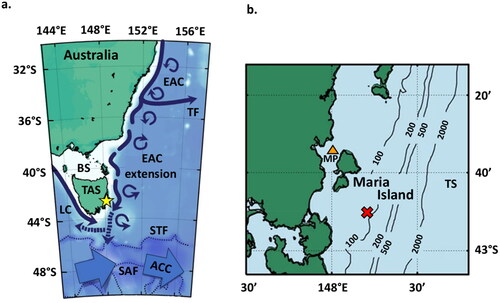
Figure 2. Dinoflagellate cyst abundance (per gram dry weight) at MCS3-T2 (inshore), MCS1-T6 (offshore surface), and GC02-S1 (offshore deep) determined from palynological analysis. Total cyst abundance varied between sites (a,i,p). Most abundant were cysts of Protoceratium reticulatum (b,j,q), Protoperidinium spp. (c,k,r) and Spiniferites spp. (d,l,s). The rare Polykrikos spp. (e), Gymnodinium microreticulatum (f), G. catenatum (g) were detected inshore only whilst Impagidinium spp. (m,t) and Nematosphaeropsis (n,u) occurred offshore only. Cysts of the Alexandrium tamarense complex were detected using both light microscopy (red silhouette) and primulin staining (black dots) inshore (h) and offshore (o,v).
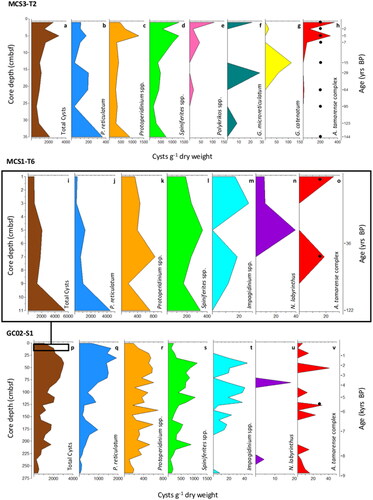
Figure 3. Dinoflagellate cyst relative abundance (%) at (a) MCS3-T2 (inshore), (b) MCS1-T6 (offshore surface), and (c) GC02-S1 (offshore deep) determined from palynological analysis.
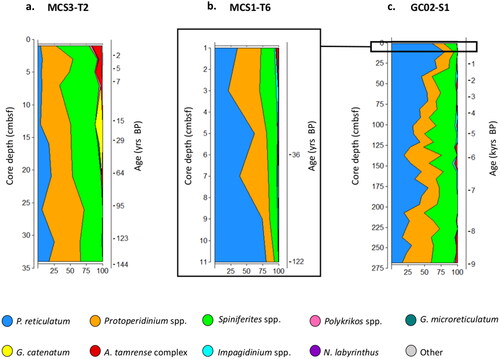
Figure 4. Principal component analysis of dinoflagellate cyst count data (a), Inshore (MCS3-T2) depth samples (green) ordinated to the left, largely separated from offshore surface (MCS1-T6, yellow) and deep samples (GC02-S1, orange) positioned to the right of the x-axis (PC1). Species vectors indicated an inshore community strongly influenced by Spiniferites and Protoperidinium spp., and Protoceratium reticulatum offshore. PCA applied exclusively to the offshore long core GC02-S1 (b) placed the lower and upper core sections into coherent groups. Mid core instability was characterised by cyclic oscillations (arrows) in response to changes in abundance of dominant genera, as represented by vectors in (c).
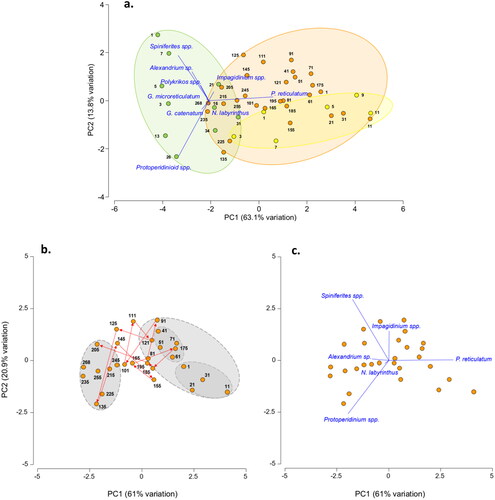
Figure 5. Species diversity and richness depth profiles of dinoflagellate cysts. Both species diversity (blue) and richness (red) displayed highest measures in the upper most samples of the MCS3-T2 and MCS1-T6 cores. For GC02-S1, maximum species diversity and richness were achieved at 150 cmbsf (∼6.2 kyrs BP).
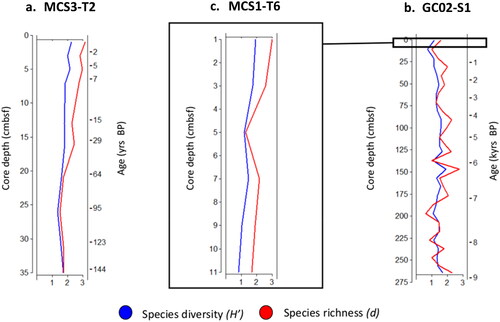
Figure 6. Depth profiles of autotroph (green) v heterotroph (orange) dinoflagellate cysts from MCS3-T2 (inshore), MCS1-T6 (offshore surface) and GC02-S1 (offshore deep) from waters surrounding Maria Island, southeast Australia. Grey represents contribution of prolific cyst producer Protoceratium reticulatum to the autotroph relative abundance.
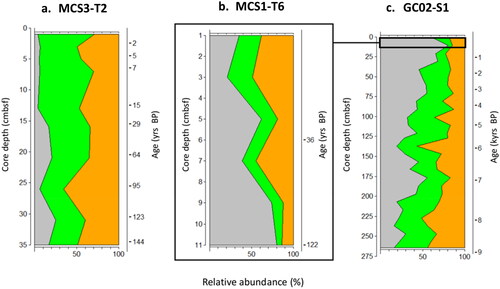
Table 1. Comparison of dinoflagellate cysts from Australian and international surveys.
Plate 1. Light photomicrographs (LM) and scanning electron micrographs (SEM) of dinoflagellate cysts in the marine sediment core archive from Maria Island. (a) Protoceratium reticulatum with long processes (LM) diameter = 35 µm, (b) P. reticulatum with short processes (LM) diameter = 45 µm, (c) P. reticulatum (SEM) diameter = 40 µm, (d) P. reticulatum showing archaeopyle (SEM) diameter = 45 µm, (e) Protoperidinium subinerme (LM) diameter = 55 µm, (f) P. subinerme apical view showing archaeopyle (LM) diameter = 50 µm, (g) P. oblongum showing archaeopyle (LM) diameter = 60 µm, (h) P. avellana showing archaeopyle (LM) diameter = 40 µm, (i) Protoperidinium ‘round brown’ sp. (LM) diameter = 40 µm, (j) Protoperidinium sp. ‘round brown’ (SEM) diameter = 40 µm, (k) Protoperidinium sp. ‘round brown’ with operculum (LM) diameter = 45 µm, (l) P. conicum (LM) diameter = 55 µm, (m) P. shanghaiense non P. pentagonum (LM) diameter = 70 µm, (n) P. shanghaiense non P. pentagonum (SEM) diameter = 75 µm, (o) Spiniferites bulloideus (LM) diameter = 40 µm, (p) S. bulloideus (SEM) diameter = 38 µm, (q) S. ramosus (LM) diameter = 45 µm, (r) S. ramosus (SEM) diameter = 46 µm, (s) S. membranaceus (LM) diameter = 40 µm, (t) S. membranaceus (SEM) diameter = 45 µm, (u) S. mirabilis (LM) diameter = 50 µm, (v) S. mirabilis (SEM) diameter = 55 µm, (w) S. hyperacanthus (LM) diameter = 55 µm, (x) S. hyperacanthus (SEM) diameter = 59 µm.
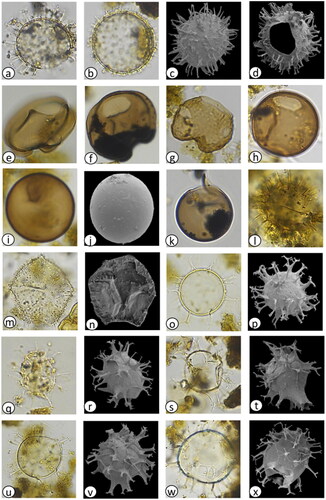
Plate 2. Light photomicrographs (LM) and scanning electron micrographs (SEM) of dinoflagellate cysts in the marine sediment core archive from Maria Island. (a) Spiniferites pachydermus cross section (LM) diameter = 50 µm, (b) S. pachydermus dorsal view (LM) diameter = 50 µm, (c) Polykrikos kofoidii (LM), length = 80 µm, (d) Impagidinium aculeatum cross section (LM) diameter = 35 µm, (e) I. aculeatum dorsal view (LM) diameter = 35 µm, (f) I. paradoxum (LM) diameter = 30 µm, (g) I. patulum (LM) diameter = 50 µm, (h) I. patulum dorsal view (LM) diameter = 50 µm, (i) I. plicatum (LM) diameter = 35 µm, (j) I. plicatum fragment (SEM) diameter = 33 µm, (k) I. sphaericum cross section (LM) diameter = 45 µm, (l) I. sphaericum dorsal view (LM) diameter = 45 µm, (m) Nematosphaeropsis labyrinthus (LM) main body diameter = 30 µm, (n) Pyrophacus steinii (LM) diameter = 80 µm, (o) Gymnodinium microreticulatum (LM) diameter = 25 µm, (p) G. catenatum (LM) diameter = 50 µm, (q) Detail of G. catenatum polygonal microreticulate ornamentation.
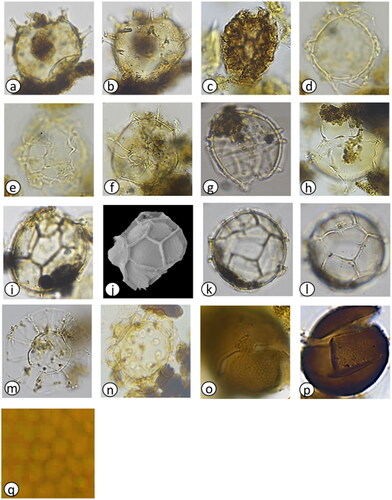
Plate 3. Inshore Alexandrium tamarense complex images captured during light microscopy and primulin staining fluorescence presented in depth of occurrence: (a–e) 1 cmbsf (1 yr), (f–j) 3 cmbsf (3 yrs), (k–o) 5 cmbsf (5 yrs), (p–t) 7 cmbsf (7 yrs), (u,v) 13 cmbsf (15 yrs), (w) 21 cmbsf (64 yrs), (x,y) 26 cmbsf (95 yrs).
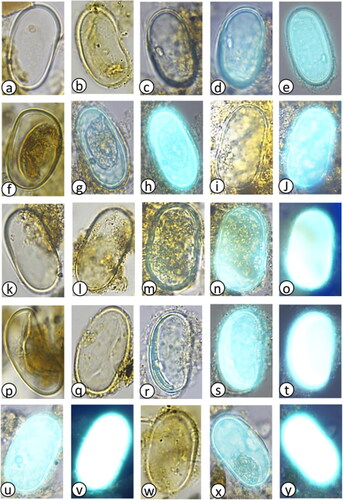
Plate 4. Offshore Alexandrium tamarense complex images and putative monolete spores captured during light microscopy and primulin staining fluorescence presented in depth of occurrence: (a–d) 0–1 cmbsf (38 yrs), (e) 4–5 cmbsf (80 yrs), (f,g) 6–7 cmbsf (103 yrs), (h) 10–11 cmbsf (189), (i) 20–21 cmbsf (709 yrs), (j) 50–51 cmbsf (2.3 kyrs), (k) 100–101 cmbsf (4.7 kyrs), (l–p) 125 cmbsf (5.7 kyrs), (q–s) 145 cmbsf (6.2 kyrs), (t) 255 cmbsf (8.6 kyrs). Putative monolete spores, (u,v) 145 cmbsf (6.2 kyrs), (w) 215 cmbsf (7.8 kyrs), (x) 235 cmbsf (8.2 kyrs), and (y) 265 cmbsf (8.9 kyrs).
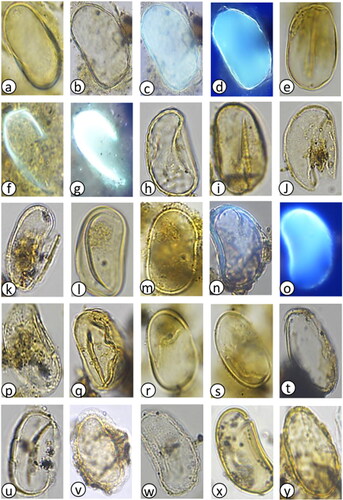
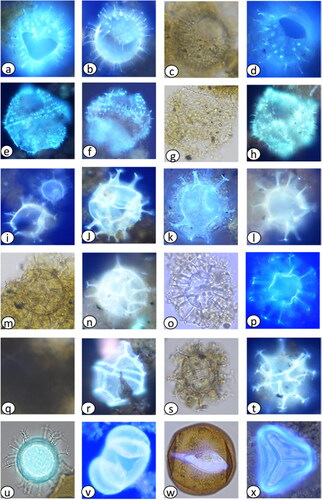
Plate 5. Various dinoflagellate cysts and other palynomorphs following the application of primulin stain. (a–d) Cysts of Protoceratium reticulatum, diameter = 38–48 µm, (a) inshore 7 cmbsf, (b) inshore 35 cmbsf, (c) inshore 7 cmbsf, (d) inshore 7 cmbsf, (e–h) Protoperidinium shanghaiense, diamter = 65–70 µm, (e) inshore 21 cmbsf, (f) inshore 31 cmbsf, (g) offshore 5 cmbsf, (h) offshore 5 cmbsf, (i–n) Spiniferites spp. diameter = 40–50 µm, (i) offshore 1 cmbsf, (j) offshore 51 cmbsf, (k) inshore 26 cmbsf, (l) offshore 5 cmbsf, (m) offshore 5 cmbsf, (n) offshore 5 cmbsf, (o,p) Nematosphaeropsis labyrinthus, diameter = 25–30 µm, (o) offshore 1 cmbsf, (p) offshore 1 cmbsf, (q,r) Impagidinium spp. diameter = 40 µm, (q) offshore 265 cmbsf visibility without fluorescence, (r) offshore 265 cmbsf with fluorescence, (s,u) Spiniferites spp. diameter = 40–50 µm, (s) offshore 125 cmbsf, (t) offshore 125 cmbsf, (u) inshore 7 cmbsf, (v) Pinus radiata pollen, diameter = 70 µm, offshore 7 cmbsf, (w,x) Terrestrial plant spores, (w) diameter =55 µm, offshore 3cmbsf, (x) diameter = 68 µm, inshore 35 cmbsf).
Data availability statement
Datasets related to this paper can be found at: https://doi.org/10.25959/24KP-R337, hosted by the IMAS metadata catalogue.