Figures & data
Figure 1. The structural layout of ozone chamber. Ozone chamber is made of polypropylene and is 4.6 m long, 2.2 m high, and 2.0 m wide (20.24 m3). It consists of a single door, glove port and transfer hatch for materials. The chamber is equipped with a 2B Tech 106-M ozone monitor, Devilbiss 1025 oxygen concentrator and a Q5 ozone generator 10 g/h with PLC control 20 mA output, GAS sonic 10 L humidifier and Faran HR-DHTC humidistat. Floor mounted fans ensure homogenous mixing of ozone within the chamber.
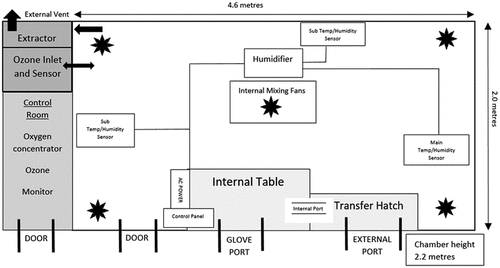
Figure 2. The internal and working area view of the bioaerosol chamber at Cardiff Metropolitan University. Left to right; Inside the chamber looking toward transfer port; Working area as seen from exterior showing steel discs in used in testing; the Author undertaking analysis in the working position.
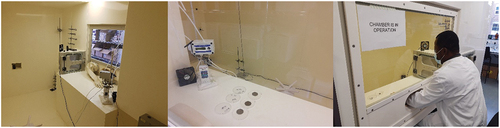
Figure 3. The effect of 40 ppm gaseous ozone on HSV-1 viability. Twenty microliters of virus was coated in wells of TC plates (a) or surfaces of steel discs (b) and exposed to gaseous ozone at 40 ppm for 1.5, 3, 6 and 8 hours. Untreated viruses at T = 0, 1.5, 3, 6 and 8 hrs were included as negative controls to each experiment. Data represents the mean of triplicate experiments ± SD. (***) represents statistical significance less than 0.000001.
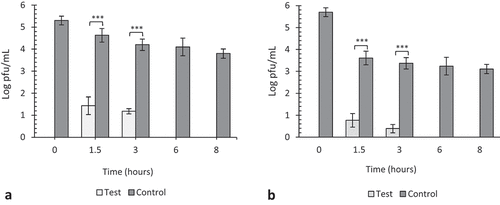
Figure 4. The effect of 20 ppm gaseous ozone on HSV-1 viability. Twenty microliters of virus was coated in wells of TC plates (a) or surfaces of steel plates (b) and exposed to gaseous ozone at 20 ppm for 1.5, 3, 6 and 8 h. Untreated viruses at T = 0, 1.5, 3, 6 and 8 hrs were included as negative controls to each experiment. Data represents the mean of triplicate experiments ± SD. (ns) represent no significant difference between groups, (***) represents statistical significance less than 0.00001.
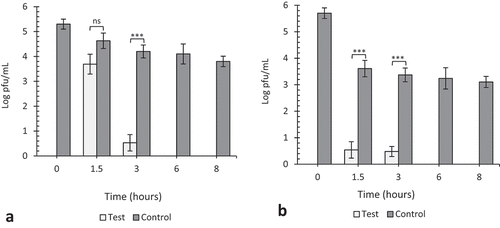
Figure 5. The effect of 10 ppm gaseous ozone on HSV-1 viability. Twenty microliters of virus was coated in wells of TC plates (a) or surfaces of steel plates (b) and exposed to gaseous ozone at 10ppm for 1.5, 3, 6 and 8 hours. Untreated viruses at T = 0, 1.5, 3, 6 and 8 hrs were included as negative controls to each experiment. Data represents the mean of triplicate experiments ± SD. (ns) represent no significant difference between groups, (*), (**) and (***) represents statistical significance less than 0.001, 0.0001 and 0.00001 respectively.
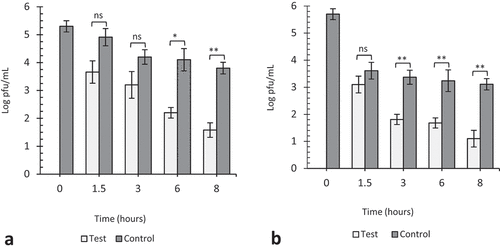
Figure 6. The effect of 5 ppm gaseous ozone on HSV-1 viability. Twenty microliters of virus was coated in wells of TC plates (a) or surfaces of steel plates (b) and exposed to gaseous ozone at 5ppm for 1.5, 3, 6 and 8 hours. Untreated viruses at T = 0, 1.5, 3, 6 and 8 hrs were included as negative controls to each experiment. Data represents the mean of triplicate experiments ± SD. (ns) represent no significant difference between groups, (**) and (***) represents statistical significance less than 0.0001 and 0.00001 respectively.
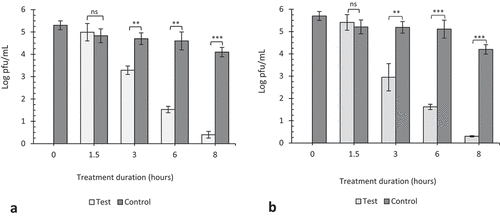
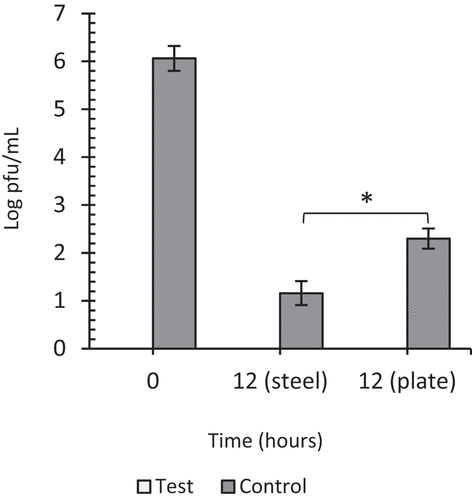
Figure 7. The effect of 1 ppm gaseous ozone on HSV-1 viability. Twenty microliters of virus was coated in wells of TC plates or surfaces of steel plates and exposed to gaseous ozone at 1ppm for 12 hours. Untreated viruses at T = 12 hrs were included as negative controls to each experiment. Viral infectivity was eliminated after 12 hours of exposure on steel and plastic surfaces. Data represents the mean of triplicate experiments ± SD. (*) represents statistical significance less than 0.001.