
Figures & data
Table 1. Descriptive statistics and correlations (product-moment correlation coefficients).
Table 2. Linear regression models predicting late life offending.
Figure 1. The interaction of risk-taking and empathy.
Note: Risk-taking and empathy were dichotomised at the median.
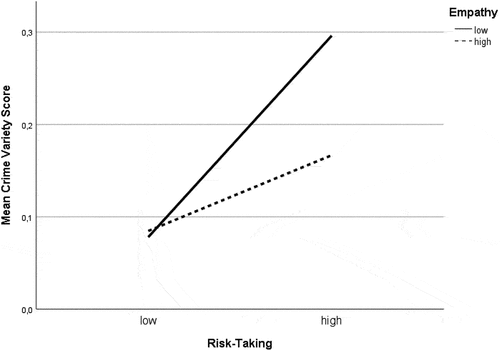
Table 3. Marginal effects of risk-taking at representative values of empathy (marginal effects from negative binomial regression models).