Figures & data
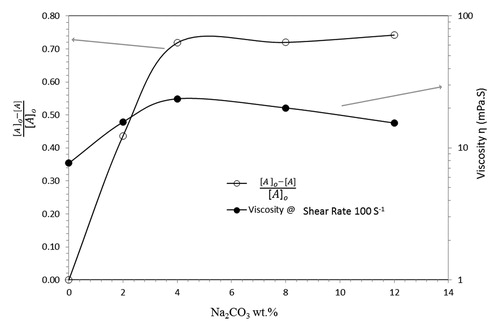
Table 1. EDX analysis for raw, purified and activated bentonite
Figure 1. Bentonite recovery from wet and dry sieving.
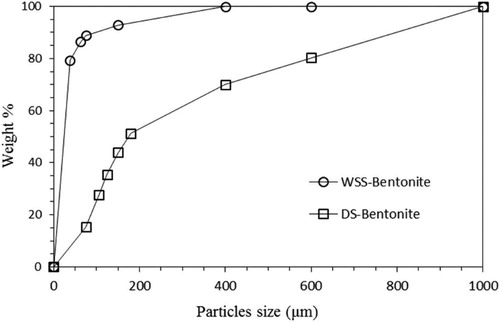
Figure 2. Effect of purification of raw bentonite on the PSD compared to commercial bentonite.
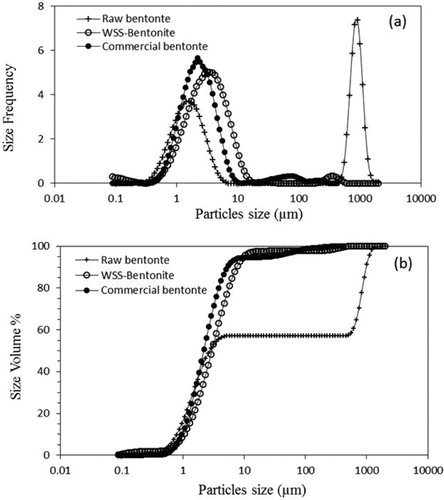
Figure 3. Effect of the Na2CO3 treatment on swelling using PSD.
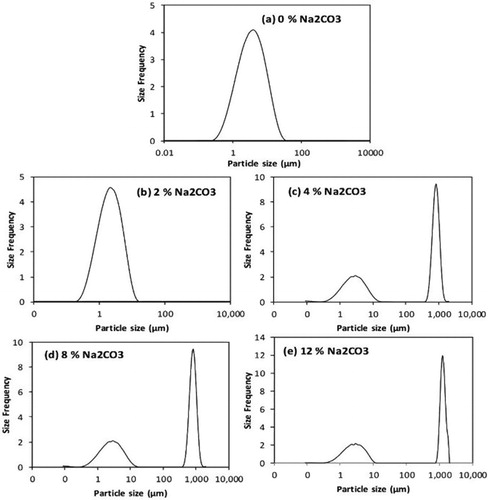
Table 2. Impact of Na2CO3 addition at room temperature on PSD analysis after 24 hrs.
Figure 4. The effect of Na2CO3 treatment on swelling and rheology.
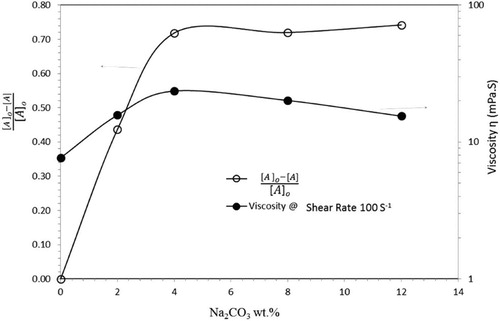
Figure 5. Effect of combined heating and stirring on PSD of Ca-bentonite and Na-bentonite.
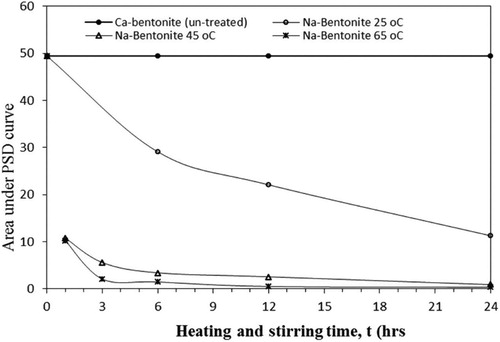
Figure 6. Effect of the thermochemical treatment on the swelling of bentonite using PSD.
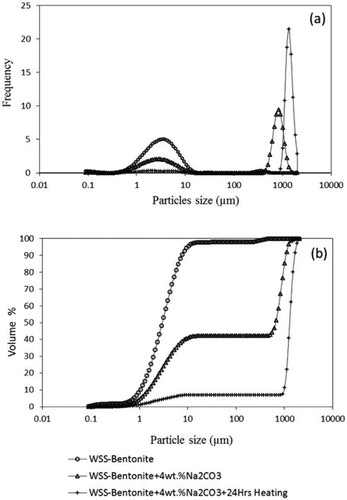
Table 3. Impact of 4 wt.% Na2CO3 on PSD analysis
Figure 7. Effect of the heating time on swelling using particles size D10, D50, and D90, and rheology of thermally treated Na-bentonite.
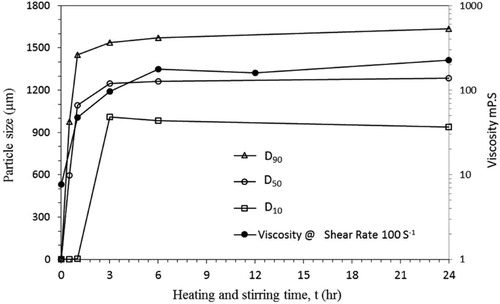
Figure 8. A plot of 1/[A] vs. time for thermally treated Na-bentonite at 25 °C, 45 °C, and 65 °C.
![Figure 8. A plot of 1/[A] vs. time for thermally treated Na-bentonite at 25 °C, 45 °C, and 65 °C.](/cms/asset/49428621-644b-4b57-a4fd-0ab1a6642524/ldis_a_1612758_f0008_b.jpg)
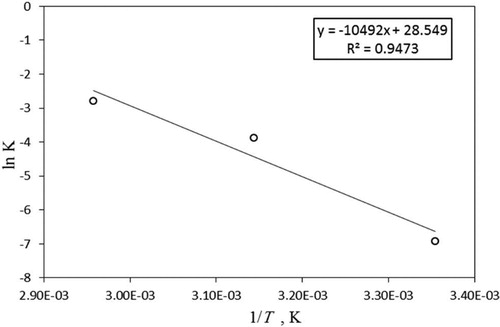
Table 4. Temperature dependence and reaction energy calculation
Figure 9. A plot of ln k vs. 1/T, K−1 for thermally treated Na-bentonite.