
Figures & data
Figure 1. Flowchart for inclusion, in numbers
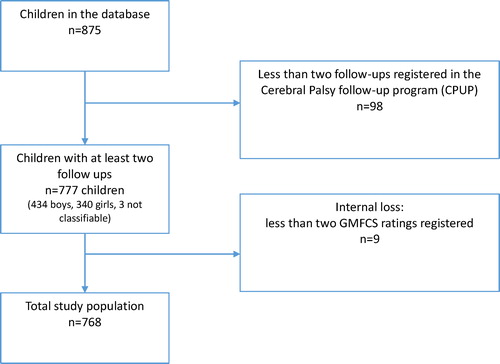
Table 1. Children’s year of birth.
Table 2. Number of GMFCS ratings per child.
Table 3. Absolute number and percentage of children without change of GMFCS level and those with change, divided by level at first assessment, number (n) and percentage (% and median, mean and SD of the standard deviation of change of GMFCS level expressed against initial GMFCS level.
Table 4. Cross-tabulation of GMFCS level at first and last assessment, in absolute numbers. Numbers in bold indicate the total amount of children with similar GMFCS level at first and last assessment.
Table 5. Linear regression. Univariate analysis for the association with GMFCS-SD (dependent variable) and personal and treatment-related factors. Number of children in the analysis (n), median, minimum and maximum (min - max), for those who had changed and those who did not change GMFCS level during the follow-up period). The standardized regression coefficient (beta), 95% confidence interval (95%CI) for beta and p-value.
Table 6. Multiple regression analysis for the relationship between significant personal and treatment-related variables from the initial model and GMFCS-SD (dependent variable). The regression coefficient (beta), 95% confidence interval for beta and p-value in initial and final model.