
Figures & data
Table 1. Description of measurements with the myometer. Position and stabilization of the subject, placement of the myometer’s resistance to the body movement and point for measurement of lever arm.
Table 2. Description of participants, mean (SD).
Figure 1. Box plot for four muscle groups in the arms, divided by MACS level. Data in % of predicted value, boxes indicating median and 25–75 percentile, and circles show observations outside 10 or 90 percentile. Dashed line indicating predicted normal.
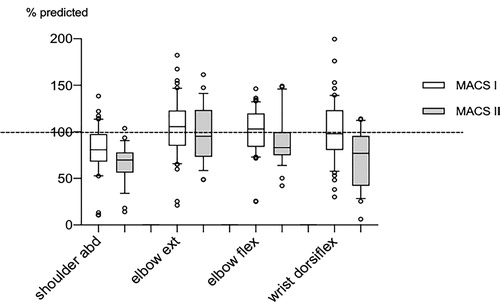
Table 3. Mean muscle strength in four muscle groups in the arms and grip strength. Data divided by MACS level and split by hand dominance. Values presented as % of predicted normal, mean (SD), and grip strength in Newton. Difference between non-dominant and dominant side calculated as a ratio.
Table 4. Correlations between muscle strength and age, weight and height.