2,883
Views
85
CrossRef citations to date
0
Altmetric
Articles

From the Subprime to the Exotic: Excessive Mortgage Market Risk and Foreclosures

Pages 59-76 | Published online: 08 Feb 2008

Figures & data

Figure 1. Percentage of U.S. home purchase loans that are government-guaranteed and subprime and percentage of U.S. home refinances by subprime lenders, 1993–2003: Source: HMDA data compiled by CitationScheessele (1999) for 1993 to 1996, and by author using CitationFederal Financial Institutions Examination Council (2007) data for 1997–2004.
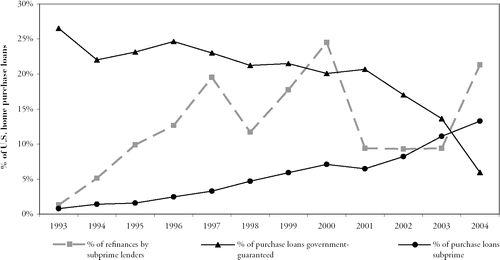
Figure 1. Percentage of U.S. home purchase loans that are government-guaranteed and subprime and percentage of U.S. home refinances by subprime lenders, 1993–2003: Source: HMDA data compiled by CitationScheessele (1999) for 1993 to 1996, and by author using CitationFederal Financial Institutions Examination Council (2007) data for 1997–2004.

Figure 2. Increase in the subprime share of home purchase loans 1997–2003 versus median 1997 loan amounts, for 103 large U.S. metropolitan areas: Source: Author's calculations using HMDA data from CitationFederal Financial Institutions Examination Council (2007).
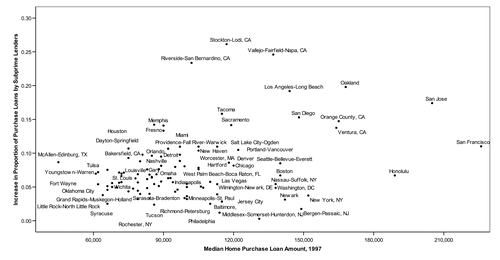
Figure 2. Increase in the subprime share of home purchase loans 1997–2003 versus median 1997 loan amounts, for 103 large U.S. metropolitan areas: Source: Author's calculations using HMDA data from CitationFederal Financial Institutions Examination Council (2007).

Table 1. Results of model predicting share of 2003 home purchase loans made by subprime lenders in U.S. metropolitan areas with populations over 500,000 in 2000.

Figure 3. Percentage of conventional jumbo and non-jumbo mortgages with adjustable rates, 1990–2004: Source: CitationFederal Housing Finance Board (2006).
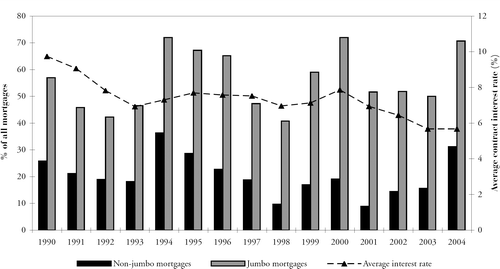
Figure 3. Percentage of conventional jumbo and non-jumbo mortgages with adjustable rates, 1990–2004: Source: CitationFederal Housing Finance Board (2006).

Figure 4. Proportion of conventional mortgages with adjustable rates versus average home purchase price, for 31 large U.S. metropolitan areas, 2004: Source: CitationFederal Housing Finance Board (2006).
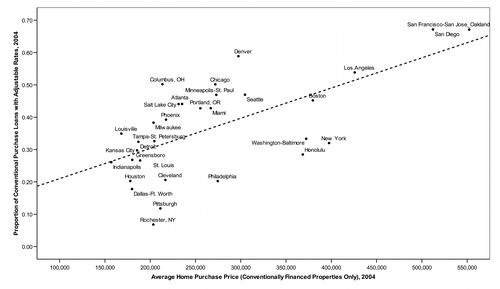
Figure 4. Proportion of conventional mortgages with adjustable rates versus average home purchase price, for 31 large U.S. metropolitan areas, 2004: Source: CitationFederal Housing Finance Board (2006).

Figure 5. Foreclosure filing rates versus subprime lender shares of home purchase loans for 81 large U.S. metropolitan areas: Sources: Foreclosure filing rate calculated by the author using data from CitationRealtyTrac, Inc. (2006) and HMDA data from CitationFederal Financial Institutions Examination Council (2007). Share of home purchaseloans that were subprime calculated by the author using HMDA data from CitationFederal Financial Institutions Examination Council (2007).
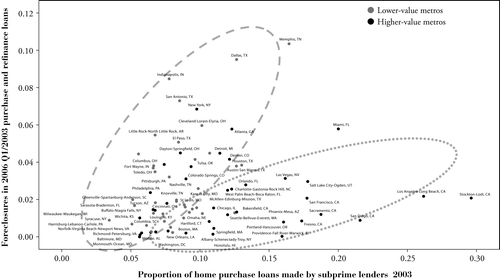
Figure 5. Foreclosure filing rates versus subprime lender shares of home purchase loans for 81 large U.S. metropolitan areas: Sources: Foreclosure filing rate calculated by the author using data from CitationRealtyTrac, Inc. (2006) and HMDA data from CitationFederal Financial Institutions Examination Council (2007). Share of home purchaseloans that were subprime calculated by the author using HMDA data from CitationFederal Financial Institutions Examination Council (2007).

Table 2. Metropolitan areas with highest and lowest levels of growth in foreclosure filingsFootnote a between the second half of 2006 and the first half of 2007.

Figure 6. Change in the proportion of housing units with a mortgage that entered the foreclosure process 1994–1995 to 2001–2005: Source: Data from CitationMidwest Foreclosures (2003).
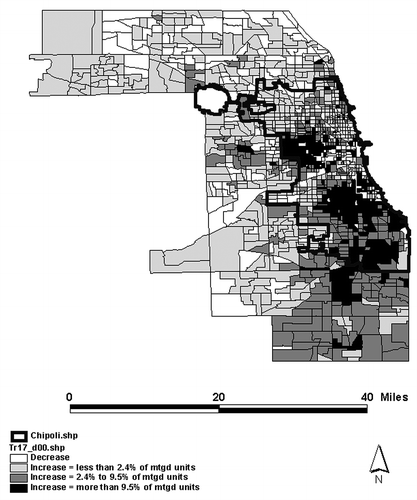
Figure 6. Change in the proportion of housing units with a mortgage that entered the foreclosure process 1994–1995 to 2001–2005: Source: Data from CitationMidwest Foreclosures (2003).

Figure 7. Adjustable rate mortgage presence and overvaluation risk, large metro markets: Sources: CitationPMI, Inc. (2006) and CitationFederal Housing Finance Board (2006).
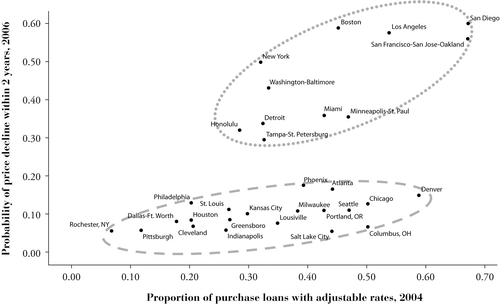
Figure 7. Adjustable rate mortgage presence and overvaluation risk, large metro markets: Sources: CitationPMI, Inc. (2006) and CitationFederal Housing Finance Board (2006).

Reprints and Corporate Permissions

Please note: Selecting permissions does not provide access to the full text of the article, please see our help page How do I view content?

To request a reprint or corporate permissions for this article, please click on the relevant link below:

Academic Permissions

Please note: Selecting permissions does not provide access to the full text of the article, please see our help page How do I view content?

Obtain permissions instantly via Rightslink by clicking on the button below:

If you are unable to obtain permissions via Rightslink, please complete and submit this Permissions form. For more information, please visit our Permissions help page.