
Figures & data
Table 1 Variables used to explain COVID-19 per capita death rate (N = 913).
Table 2 Pearson correlation between explanatory variables and confirmed virus and death rates.
Figure 1. Causal path diagram for COVID-19 death rate in terms of county density and other variables (correlational arrows among explanatory variables are not shown for the sake of simplicity and clarity).
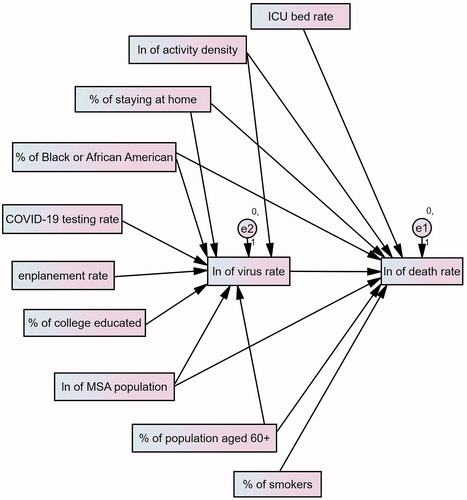
Table 3 Direct effects of density, socioeconomic, and health care characteristics on COVID-19 infection and mortality rates.
Table 4 Direct, indirect, and total effects of the county-level density and other variables on COVID-19 mortality rate.
Supplemental material