Figures & data
Figure 1. The current mean number of unhealthy retailers around secondary schools in the Waterloo Region by individual variable and buffer.
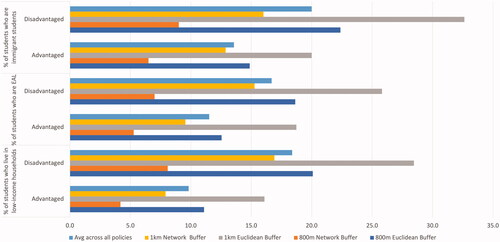
Figure 2. The current mean number of unhealthy food retailers around secondary schools by school-level advantage (i.e., disadvantaged, neither advantaged nor disadvantaged, and advantaged) and buffer type.
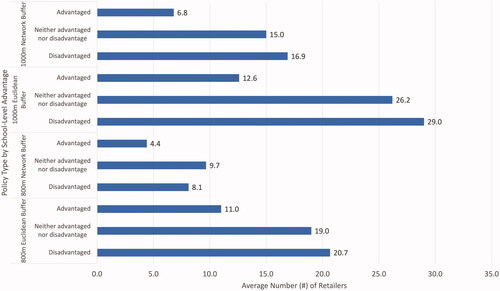
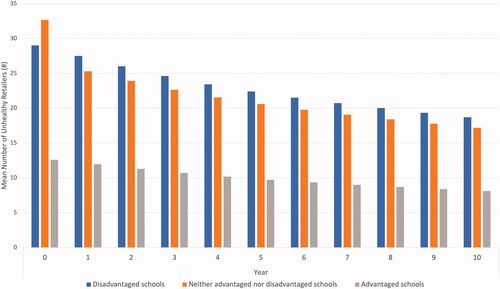
Figure 3. The projected mean number of unhealthy retailers within 1-km Euclidean distance of schools by school-level advantage over 10 years.