
Figures & data
Figure 1. Percentage of foreign-born individuals across Oregon by county. Source: Reprinted with permission from Meléndez et al., Citation2021.
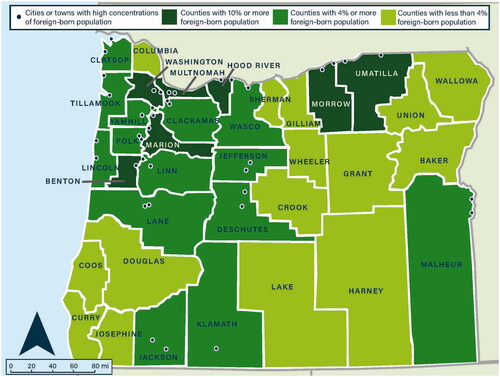
Table 1 Category data and immigrant representation findings.
Table 2 Examples of coded interview excerpts: Culture.
Table 3 Examples of coded interview excerpts: Influence.
Table 4 Examples of coded interview excerpts: Other challenges.
Table 5 Examples of barriers to serving.
Supplemental material
Technical Appendix
Download PDF (137.2 KB)Data Availability Statement
Due to the nature of this research, participants in this study did not agree for their data to be shared publicly, so supporting data are not available.