
Figures & data
Figure 1. Structural model tested simultaneously across four age groups, describing direct and indirect effects of walkability and other control variables on happiness. Direct effects are indicated using thick lines and indirect, mediated pathways are indicated using thin lines.
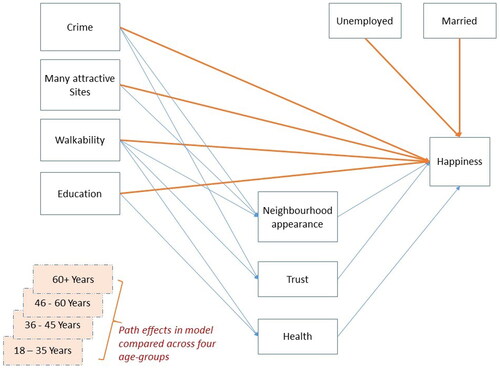
Table 1 Mean differences between high and low walkable neighborhoods for a range of resident outcomes and perceptions.
Figure 2. Examples of high walkable and low walkable neighborhoods. (a) High walkable neighborhood (photo credit: Sarah Rock, TU Dublin; see Rock et al., Citation2021); (b) Low walkable neighborhood (photo credit: Lorraine D’Arcy, TU Dublin).
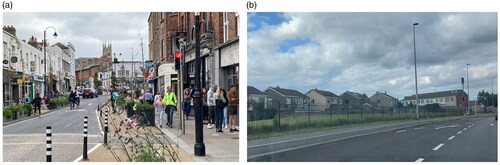
Table 2 Predictors of happiness.
Table 3 Descriptive statistics.
Table 4 Common and unique path effects across four age groups.