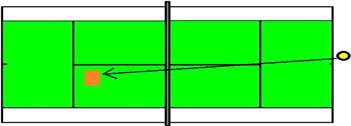
Figures & dataFigure 1. Graphical representation of the service task setting.Display full sizeTable 1. Means and standard deviations in the three conditions before and after imagery.Download CSVDisplay TableTable 2. Unstandardized mean differences between conditions and effect sizes D.Download CSVDisplay Table