
Figures & data
Figure 1. Schematic display of the study procedure.
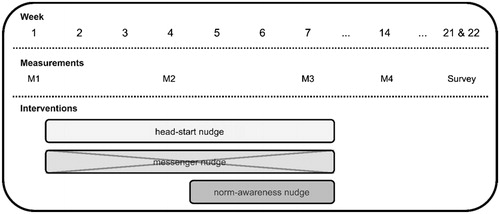
Figure 2. Percentage of employees wearing their lanyard per measurement (bold) and per counting instance (non-bold). Supervisors form a subgroup of employees. Due to the small number of supervisors per counting instance, only the average over all counting instances is displayed for them.
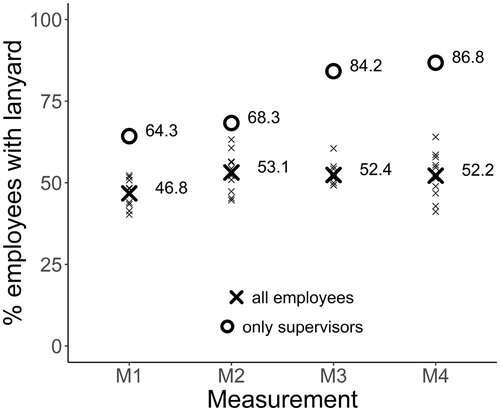
Table 1. Summary statistics for the ωc and ωc – c’ parameters.
Figure 3. Answer distributions for self-reported compliance (left) and paternalism ratings of the nudges (right).
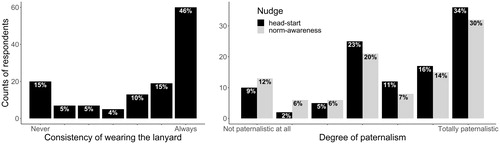
Table 2. Codes related to the lanyard policy and the nudges with a minimum prevalence of 10%.
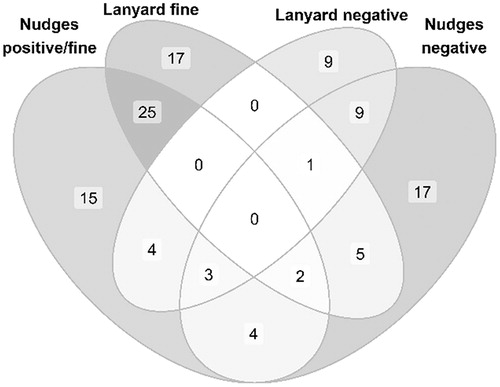
Figure 4. Co-occurrence of codes related to the nudges and the lanyard policy.
Supplemental Material
Download MS Word (36.1 KB)Data availability statement
The data that support the findings of this study are available from the corresponding author upon reasonable request.