Figures & data
Figure 1. IPE-enhanced DSP (adapted from Ikpe Citation2018).
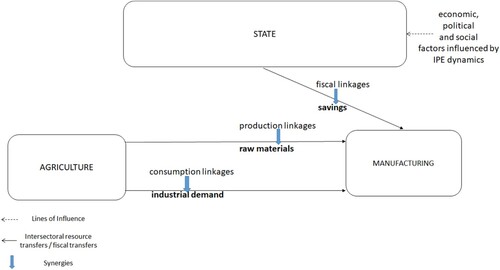
Figure 2. Manufacturing value added-MVA (% of GDP). Source: World Development Indicators (Citation2020).
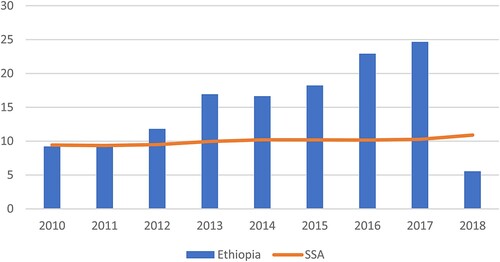
Figure 3. Composition of manufacturing value added across sectors in Ethiopia. Source: World Development Indicators (Citation2020).
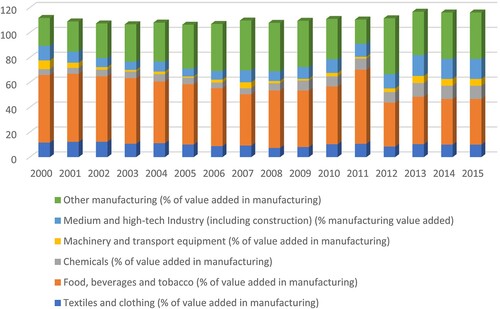
Figure 4. Savings gap in Ethiopia: gross capital formation and gross domestic saving (% of GDP). Source: World Development Indicators (Citation2020).
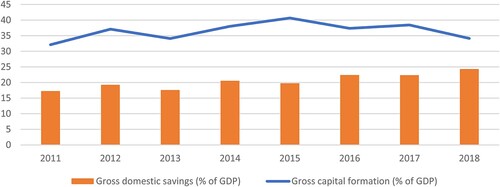
Figure 5. Exports of finished leather and leather products (USD) (stacked). Source: Unpublished data from Leather Industry Development Institute (LIDI), Addis Ababa, Ethiopia.
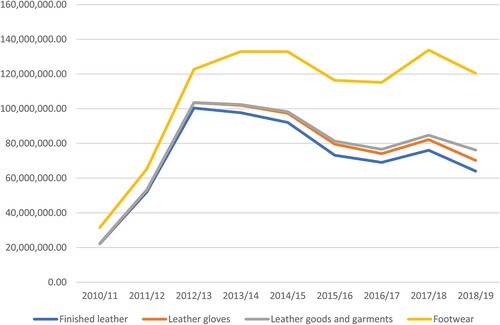
Figure 6. Quantity of finished leather and leather product exports (Sq Ft) (stacked). Source: Unpublished data from Leather Industry Development Institute (LIDI), Addis Ababa, Ethiopia.
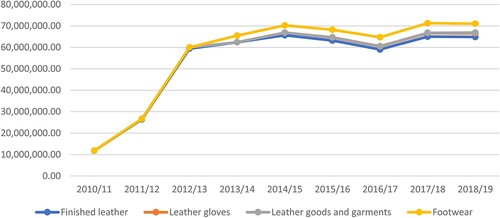
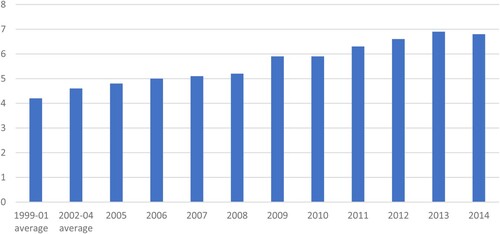
Figure 7. Leather shoe production (million pairs). Source: Food and Agricultural Organisation World statistical compendium for raw hides and skins, leather and leather footwear, 1999–2015.