Figures & data
Figure 1. Example showing the combination of various rankings into a single risk ranking for the Lake Chad–Central African Republic basin-country unit.
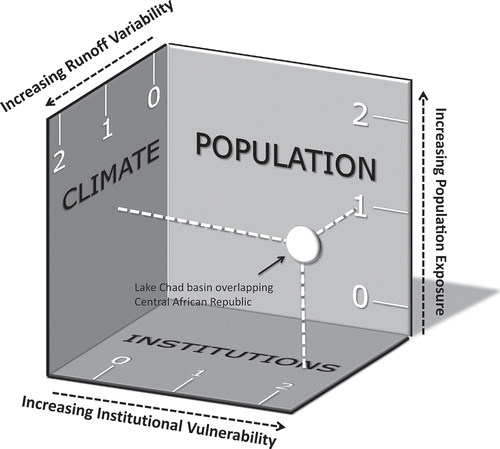
Figure 2. Ranking of current transboundary institutional vulnerability to flooding, based on contributing treaty mechanisms and presence of river basin organizations with a flood management mandate.
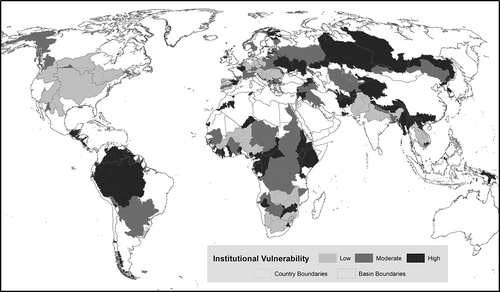
Figure 3. Changes in population coverage in each treaty score category between (bottom) institutions encompassing all forms of variability management (the definition used by De Stefano et al., Citation2012) and (top) the flood-specific ranking of institutions used in this article.
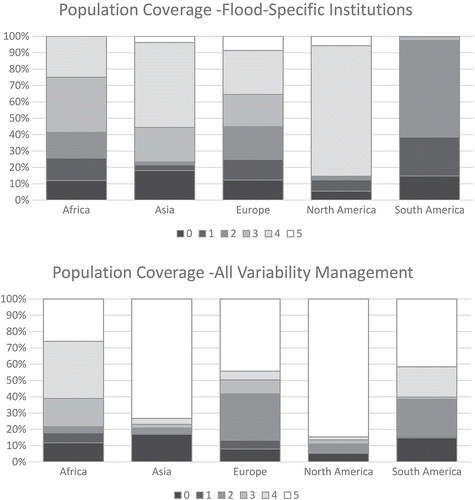
Figure 4. Ranking of hydrological hazard, defined by current runoff variability regimes combined with increases in runoff variability in 2050 as compared to 2000.
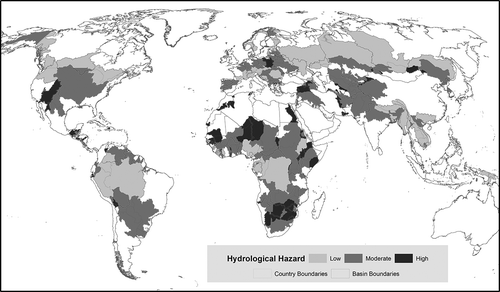
Figure 5. Ranking of increases in exposed population by basin-country units, from 2010 to 2050.
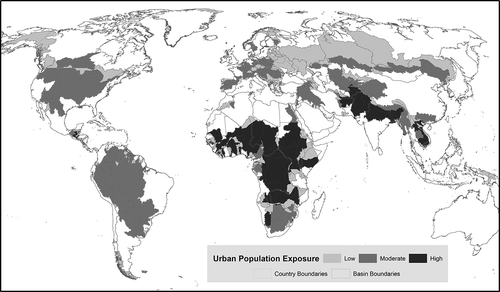
Figure 6. Proportions of basin population (left) and area (right) in each level of final risk ranking, grouped by continent.
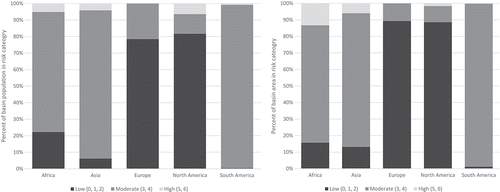
Figure 7. Combined ranking of risk based on current institutional vulnerability, and increases in exposed population and hydrological variability by 2050.
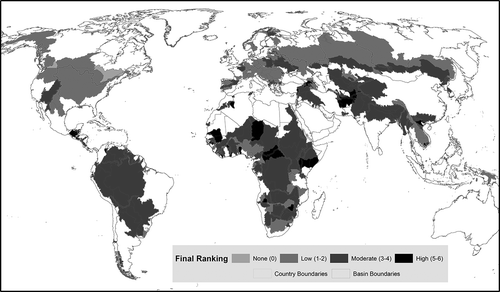
Figure 8. Final risk rankings of basin-country units in Africa.
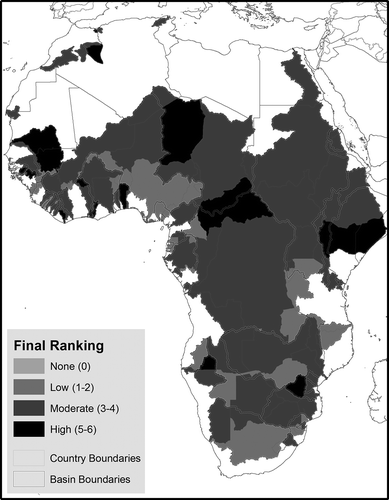
Figure 9. Final risk rankings of basin-country units in Asia.
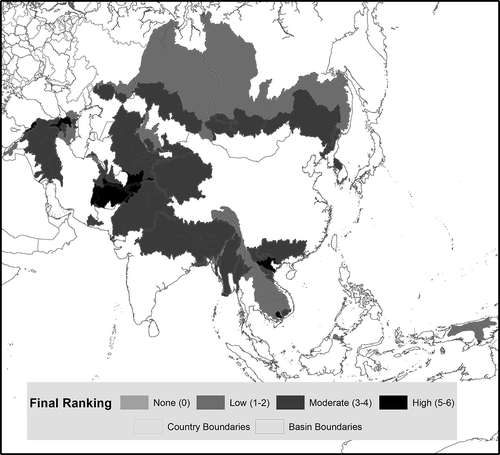
Figure 10. Final risk rankings of basin-country units in Europe.
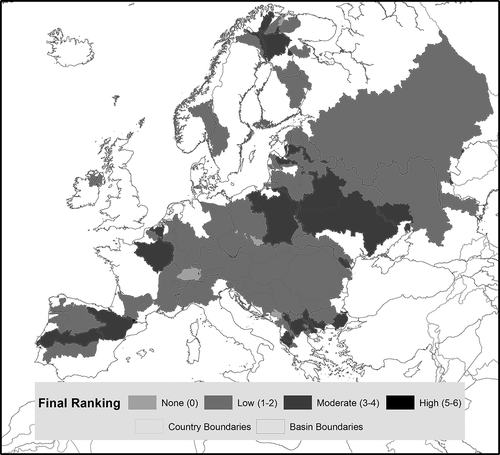
Figure 11. Final risk rankings of basin-country units in North America.
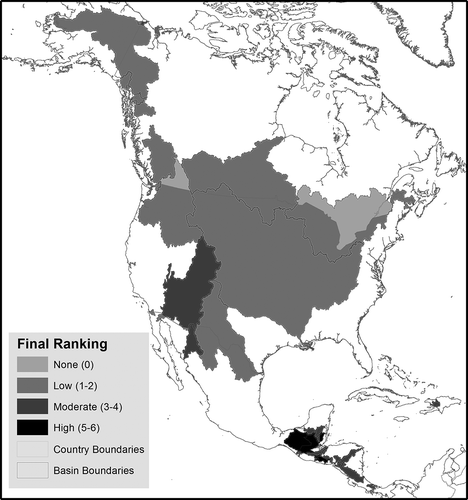
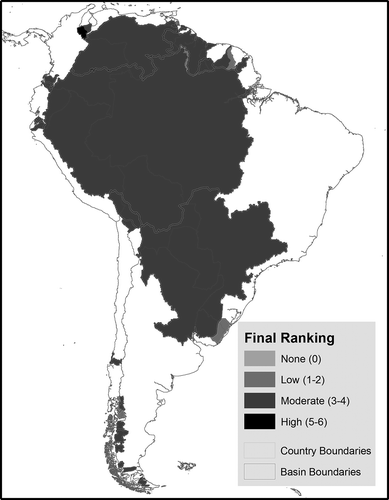
Figure 12. Final risk rankings of basin-country units in South America.