Figures & data
Figure 1. Lake Victoria’s monthly water levels, January 1998–December 2010.
Source: Data from the Lake Victoria Basin Commission Secretariat.
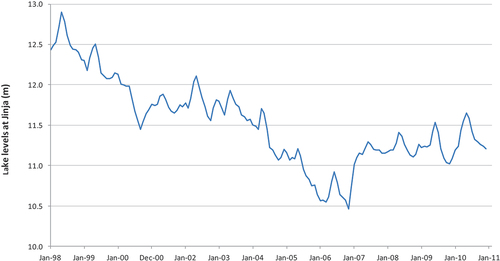
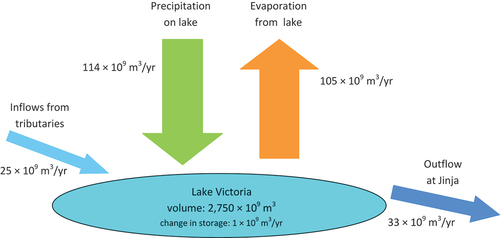
Figure 2. Water balance of Lake Victoria, averages over the period 1950–2000.
Source: LVEMP (Citation2005).