Figures & data
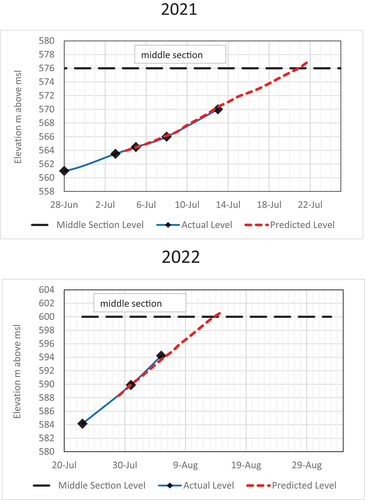
Figure 1. (a) Main features of the study area: major irrigation schemes, major cities (population > 200,000 people) and large dams; (b) affected water supply utilities in the capital Khartoum; and (c) distance between the Grand Ethiopian Renaissance Dam (GERD) and Roseires.
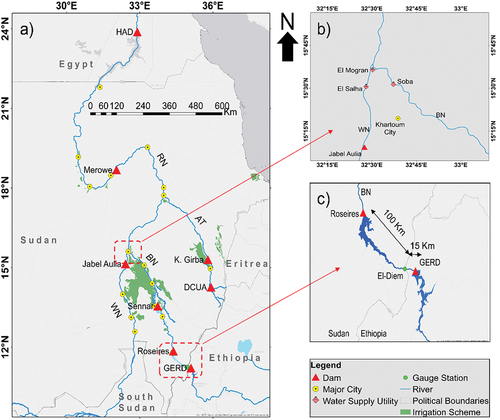
Figure 2. Analytical framework for computing river inflow into the Roseires reservoir.
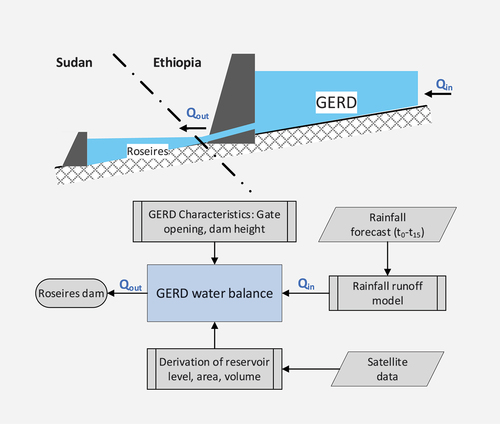
Figure 3. Main characteristics of the GERD drawn from different sources given in .
Figure 4. Middle section during overtopping in 2020 and shortly before overtopping in 2021 showing the height of the middle section.
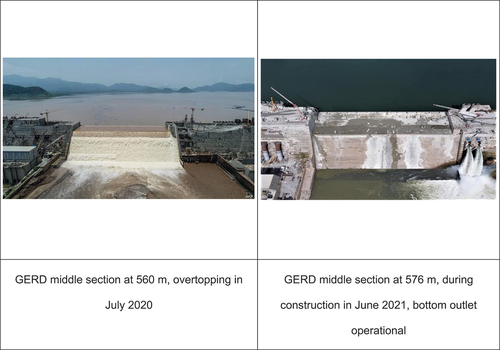
Table 1. GERD main characteristics.
Table 2. Examples of the media sources used to track the progress of the Grand Ethiopian Renaissance Dam (GERD) construction during filling of 2021 and 2022. Several other sources were also consulted.
Figure 5. Construction rate diagram of the GERD middle section height, as envisaged on 11 July 2021.
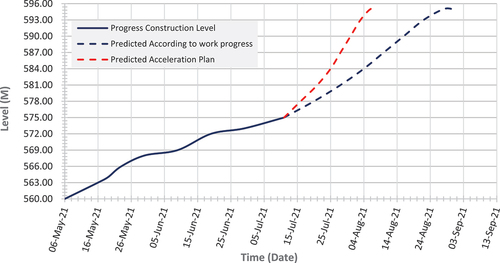
Table 3. Meso-scale hydrological model (mHM) global datasets used for the model (Lorenz et al., Citation2019).
Figure 6. Structure of the meso-scale hydrological model (mHM).
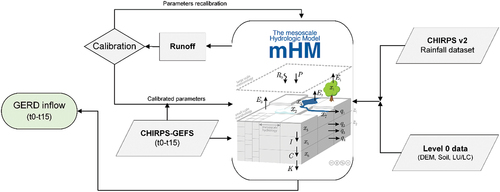
Figure 7. Flow chart of the processes of GERD’s water level derivation.
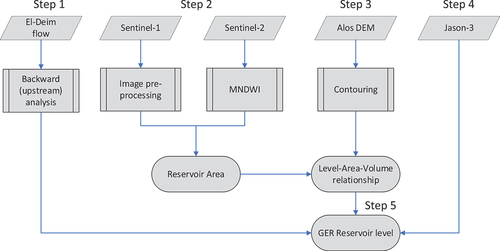
Table 4. Statistical indices for the performance of the meso-scale hydrological model (mHM) model.
Figure 8. Observed and simulated daily discharges at El–Deim station computed by the meso-scale hydrological model (mHM) derived by CHIRPS dataset: (a) calibration and (b) validation.
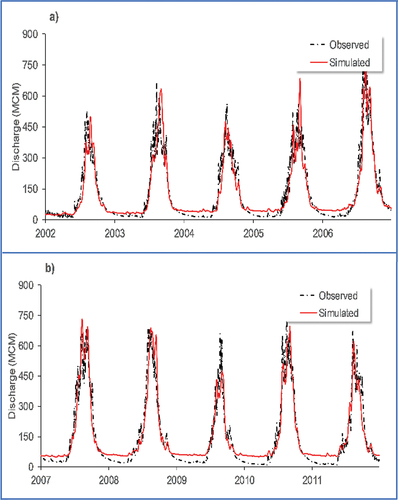
Figure 9. GERD level–area–volume relationship derived from DEM.
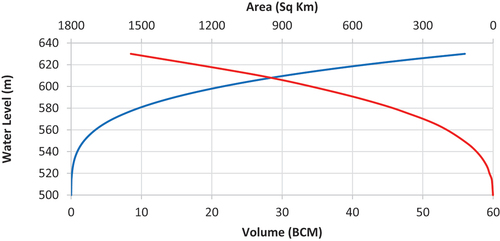
Figure 10. GERD reservoir level: reference level (actual); Sentinel-1, -2 and Jason-3 (altimetry).
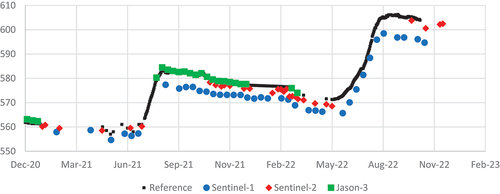
Figure 11. Correlation of the derived reference (actual) water level against Sentinel-1, -2 and Jason-3 (altimetry). The determination coefficient R2 and T-test values for statistical significance at a 95% level are shown (critical value = 2.0).
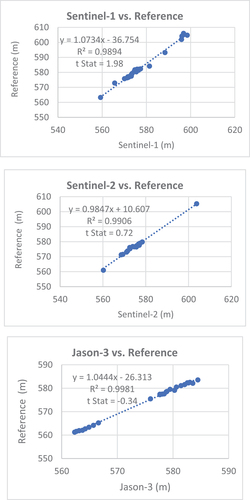
Figure 12. Derived water level from Sentinel-1, -2 and Jason-3 compared with the reference (actual), after correction.
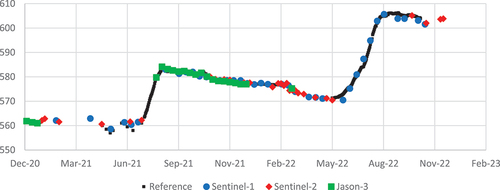
Figure 13. Measured GERD releases before, during and after the overtopping in 2020, 2021 and 2022 compared with the long-term average at El-Deim (Mm3/day).
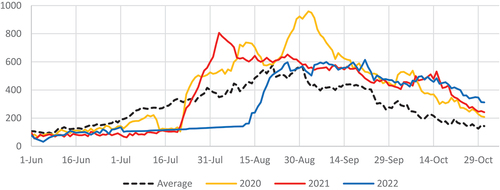
Figure 14. Predicted date of overtopping the middle section issued on 13 July 2021 (top) and 5 August 2022 (bottom).